Retirement Income
Categories
Practice Management
Build a better 401(k) for your clients
 Renee Grimm
March 21, 2024
Building a strong retirement plan involves two main decisions: The choice of recordkeeper and the choice of investments. When building a 401(k) plan, many financial professionals (FPs) typically start the process by choosing a recordkeeper and then building the investment menu. But could this conventional wisdom be backward?
It can be argued that investments are the cornerstone of retirement-wealth creation. Over a participant’s working years, even small improvements in returns can add years of spending in retirement. By helping plan sponsors choose quality investments first, FPs can help improve participant outcomes and differentiate their approaches from competitors.
Better outcomes require a better plan
Retirement plans, by nature, are a series of linked components. For the plan to be successful, the assembled chain must meet the objectives of both plan sponsors and participants. Many FPs assemble these links in a conventional order that prioritizes the selection of the retirement plan recordkeeper.
A recordkeeping-driven process
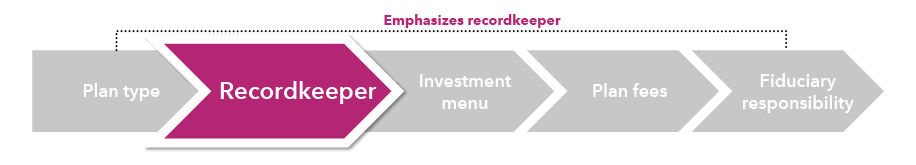
Source: Capital Group.
If you’ve been following such a process, consider changing this sequence and start with investments first. Once you’ve talked to your client and determined their needs, you’ll likely know what type of plan makes sense for that company. From that point, rather than immediately selecting a recordkeeper, consider making the next link in the chain the investment menu.
An investment-driven process

Source: Capital Group.
Why start with investments?
The most critical factor bridging the gap between what participants save and what they’ll need in retirement lies in the quality of the returns their plan’s investments can generate. Why? Investment returns are the primary engine that will drive outcomes over the long run. The below scenario tracks a hypothetical participant’s account balance over a working career, noting how much money came from contributions and how much was generated through investment returns (assuming a steady 6% annualized return).
For younger participants, contributions make up the bulk of the account balance. But by the time they reach retirement, 70% or more of the account balance could potentially come from returns, not contributions.
Returns matter more than you think
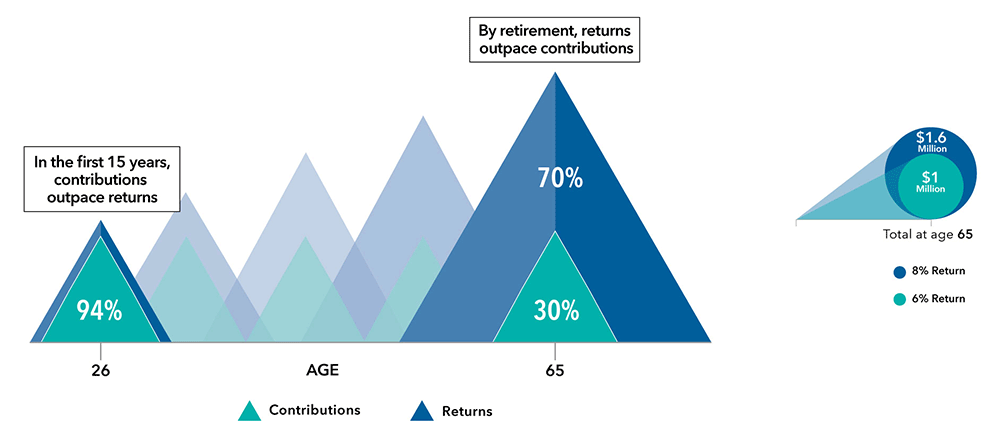
The demographic assumptions, returns and ending balances are hypothetical and provided for illustrative purposes only, and are not intended to provide any assurance or promise of actual returns and outcomes. Returns will be affected by the management of the investments and any adjustments to the assumed contribution rates, salary or other participant demographic information. Actual results may be higher or lower than those shown. The 70/30 illustrations are based on an exhibit by CBS Moneywatch. Assumptions for 70/30 rule of thumb: This hypothetical example assumes you start investing 10% of your $40,000 income at age 25. And then you continue to contribute 10% each year throughout your career, as your salary increases 3% per year.
Take another look to see how even small increases in returns can dramatically improve outcomes, adding years of retirement income.
Consider the default
Many participants end up investing the bulk of their assets in a qualified default investment alternative (QDIA) — typically a target date fund. As the foundation of many 401(k) plans, the quality of that target date fund can dramatically influence the size of a participant’s “retirement nest egg.” That’s why the choice of target date providers is one of the most important decisions for a plan sponsor — rivaling the choice of recordkeeper.
Evaluating a target date series can be a complex task. Although there are similarities among all series, each is managed differently — with varying underlying investment strategies and glide paths. Here are a few things to consider when comparing series:
- How much equity does the series have at retirement? Does the series seek to change the mix of equities over time — shifting to historically less-volatile stocks as participants age? Or does the mix of equities stay the same throughout the glide path?
- What is the series’ approach to fixed income? How does the series adjust credit quality and duration as participants age?
- How do the series’ returns rank against peers?
- How well has the series held up in recent market corrections? Has it provided the downside resilience participants expect?
- How do the fees compare relative to the value (additional returns) the series has delivered?
- How well have the underlying funds (the ingredients) fared? How long are their return histories?
Finding data to answer some of these issues doesn’t have to be difficult. To evaluate different target date series and help find a QDIA for each of their clients, FPs can use Target Date ProView. This tool provides objective, third-party data on target date series in the marketplace. In just seconds, the tool can generate comparison reports analyzing key factors such as glide path, risk, returns and expenses that you can share with clients.
Evaluate core menu options
In creating the non-target date investment menu (core menu), some people tend to prioritize the quantity of funds. The average large 401(k) plan has 20 investment options as of 2020.1 For those participants who choose their own investments, research shows that too many choices can feel overwhelming.2 Simplifying the core menu, with these considerations in mind, may support better participant decision-making:
- Avoid trying to “check” every style box in U.S. equity when choosing funds; instead, seek a few U.S. equity funds that can span style and market cap in pursuit of the most attractive opportunities. Although specialized and sector-focused funds may be appropriate for more investment-savvy investors, the average participant can be well-served by investing in broad U.S. core equity funds.
- For international equity funds, consider strategies that invest in both emerging and developed markets. You might also consider global equity funds, which provide skilled investment managers the broadest opportunity set to identify “winners.”
- Seek core bond funds that can deliver on the four main roles of fixed income in a defined contribution (DC) plan: diversification, inflation protection, income and capital preservation. A core bond fund should provide stability during equity market downturns: Look at the bond fund’s equity-market correlation and its returns during past corrections.
FP pro tip: If you select the recordkeeper before the investments, you may find yourself faced with multiple pricing scenarios based on the QDIA desired for each platform. This will not only complicate your decision for making a confident recommendation to your client, but if you should decide to present multiple options, it will probably be difficult for the client to understand.
Choose the right recordkeeper
Here are some important considerations when choosing a recordkeeper:
Cost: It is key to consider how much of the recordkeeping cost is related to recordkeeping services and how much of it comes from the investments (fund-related expenses). This is not always evident. The challenge with plan costs is that they can be difficult to understand and even harder to explain to clients.
Fee structures for retirement plans vary by recordkeeper. That’s why it’s important to understand what services and funds are included in the overall plan cost — and compare that cost to the potential value that can be delivered. Many plan sponsors may not even realize there is a distinction to be made between recordkeeping fees and investment costs or that the recordkeeper may also receive payments from investment expenses. If your client considers total cost alone, they may end up with a plan that doesn’t meet their needs. On the other hand, clients also don’t want to overpay for bells and whistles they won’t use.
Cost vs. value: Hypothetical plan comparison
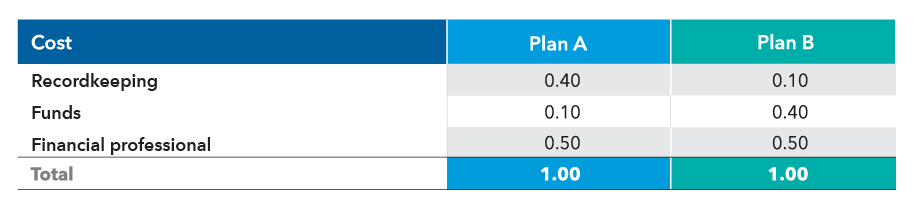
Source: Capital Group. Hypothetical example shows total cost using R-6 shares which do not do not include any payments from investment expenses to the recordkeeper or financial professional.
The above hypothetical scenario considers the total recordkeeping costs of two hypothetical plans. The total costs of the plans are the same — 100 basis points. But looking at the total number alone doesn’t tell the full story. Plan sponsors should also look at the components of that cost to analyze how it relates to value.
In the example, costs are divided into three types: recordkeeping services, fund expenses and financial professional compensation. Although financial professional compensation is equal, Plan A charges four times as much for recordkeeping services. In contrast, Plan B charges four times as much for fund costs. While plan sponsors may initially have concerns over the level of fund costs in Plan B, choosing the cheapest fund isn’t necessarily best, nor is a plan obligated to do so to meet its fiduciary duty. The example highlights the importance of looking at each component of plan costs, not just the total.
For fund expenses, consider the quality of the funds that are offered. Passive funds usually have lower fees and track the returns of indexes. Given how important investment returns are to retirement readiness, plan sponsors should consider whether typically more expensive actively managed funds could deliver stronger results than passive funds — either by outpacing during strong markets or suffering smaller losses in down markets. Passive funds are not striving to outpace their benchmarks; rather, they seek to track the benchmark’s return pattern.
Isolating recordkeeping costs can help reveal fees that could cost your clients more than they expect. Solutions that provide more transparent pricing can help them understand exactly what they’re paying and what services they’re getting. Emphasize to clients that, like target date funds, not all types of fees are created equal.
Service: This is where the right combination of technology and personal touch can really make a difference. When looking at the features of different recordkeeping solutions, focus on the true benefits and how they affect the user experience. Does the recordkeeper offer distinguishing service or technological capabilities that justify higher fees? The plan should help participants feel motivated to save for the future and empowered to make the most of their company retirement plan.
FP pro tip: You can help your clients balance the level of services needed with the cost they are comfortable paying. Furthermore, work with your providers to prepare a quote that clearly lays out what is included in their fee, broken out to show the specific amounts charged for recordkeeping services and investments. FPs can use this checklist to guide their efforts in finding the right recordkeeper for their plans.
Cost and service are two areas that can become pain points if not properly addressed. Deficiencies in either of these areas are often the reasons why a company switches retirement plan providers.
Clients need your help
Done correctly, retirement plan business can offer a great return on investment — for employers, for their employees and for FPs, helping more clients and growing their practice. Success lies in building that better 401(k).
Learn more about
1 The BrightScope/ICI Defined Contribution Plan Profile: A Close Look at 401(k) Plans, 2020. BrightScope and Investment Company Institute, September 2023.
2 Simplifying Choices in Defined Contribution Retirement Plan Design, Donald B. Keim and Olivia S. Mitchell, National Bureau of Economic Research, Working Paper No. 21854, January 2016.
Our latest insights
-
-
Retirement Income
-
Target Date
-
Participant Engagement
-
Practice Management
RELATED INSIGHTS
-
Retirement Income
-
Retirement Income
-
Target Date
Never miss an insight
The Capital Ideas newsletter delivers weekly investment insights straight to your inbox.
Investments are not FDIC-insured, nor are they deposits of or guaranteed by a bank or any other entity, so they may lose value.
Investors should carefully consider investment objectives, risks, charges and expenses.
This and other important information is contained in the fund prospectuses and summary prospectuses, which can be obtained from a financial professional and should be read carefully before investing.
Statements attributed to an individual represent the opinions of that individual as of the date published and do not necessarily reflect the opinions of Capital Group or its affiliates. This information is intended to highlight issues and should not be considered advice, an endorsement or a recommendation.
All Capital Group trademarks mentioned are owned by The Capital Group Companies, Inc., an affiliated company or fund. All other company and product names mentioned are the property of their respective companies.
Use of this website is intended for U.S. residents only. Use of this website and materials is also subject to approval by your home office.
On or around July 1, 2024, American Funds Distributors, Inc. will be renamed Capital Client Group, Inc.
This content, developed by Capital Group, home of American Funds, should not be used as a primary basis for investment decisions and is not intended to serve as impartial investment or fiduciary advice.