Global Equities
Categories
Fed
Bond yields likely to remain higher for longer as Fed stands firm
 Pramod Atluri
 Anmol Sinha
November 1, 2023
The U.S. Federal Reserve kept its benchmark interest rate unchanged this week for the second meeting in a row just as the Bank of Canada (BoC) did last week. But unlike the BoC, which paused due to rapidly decelerating economic growth, the Fed held steady despite resilient economic data highlighting a stronger growth environment and the risk that U.S. inflation remains well above 2% for an extended period.
U.S. Treasury yields have risen sharply since September after the Fed updated its “dot plot” forecast to show two fewer rate cuts in 2024 than the market had been expecting. Longer-dated bonds have taken the brunt of the pain: The benchmark 10-year Treasury yield has risen nearly 50 basis points since the dot plot was released on September 20 and briefly eclipsed 5% in October for the first time since 2007.
So, what is driving this shift in yields? Surprisingly resilient growth has been a contributor, along with technical factors relating to higher expected Treasury issuance and stagnating demand. Markets are increasingly pricing in a view that the Fed will maintain a higher for longer stance — that is, rates broadly may remain at these higher levels for an extended period.
Portfolio manager Pramod Atluri argues that high deficits, along with challenges to tighter monetary policy filtering through to the real economy, have helped bolster growth more than expected. Growth may continue to remain resilient as a function of more dominant fiscal policy, leading the Fed to maintain policy at restrictive levels for longer than markets expect.
Importantly, investors should be mindful that financial market volatility likely persists even with resilient underlying economic growth. This should be an attractive market for fixed income, as higher yields can offer compelling income and return potential while also buffering against potential price volatility. There is also an opportunity for meaningful price appreciation should rates fall due to a growth shock. “The biggest risk to continued economic growth could be a combination of higher interest rates and a rapid decline in the Federal deficit,” Atluri says.
Putting recent shifts in context
The market’s attention has seemingly shifted from falling inflation, which helped pull interest rates lower earlier in the year, to the large U.S. fiscal deficit and the government borrowing needed to finance it. These higher expectations for the supply of Treasuries have been exacerbated by constrained demand.
The Fed’s ongoing quantitative tightening program has reduced its holdings of Treasuries and other bonds while other traditional buyers of government debt such as banks, sovereign wealth funds and other non-U.S. buyers may have also stepped away from the market for a variety of reasons. These factors are all contributing to higher term premiums and outsized moves on the longer end of the yield curve.
The deficit is not only contributing to the increased supply of Treasuries, but also strong economic growth.
Getting fiscal: Is U.S. government spending offsetting monetary policy?
While the Fed has been moving to tighten policy rapidly, the federal budget deficit has increased from around 4% of gross domestic product (GDP) to around 8%. This is among the largest deficit increases in history, aside from COVID-19, World War II and the 2008 financial crisis, and it's happening when GDP is already growing. With fiscal and monetary policy moving in opposite directions, the net impact can be challenging for investors to discern.
The extent of the increase in the deficit, along with the sheer size of it, have bolstered growth even as some sectors of the economy may have been — or are currently in — recession. Fiscal policy’s impact has also been bolstered because the traditional channels through which monetary policy impacts the real U.S. economy — housing, autos, household wealth effects and bank lending — may not be responding as expected to higher interest rates.
In housing, demand fell with higher interest rates, but supply fell even more as a significant number of existing homeowners have mortgages well below prevailing levels. The result has been house prices actually rising, leading to robust construction activity. A similar dynamic has played out in autos, where the expected drag to this highly important economic sector has been less severe than expected given the amount of pent‐up demand for autos post-COVID.
Home prices rising and real wages growing (as inflation has fallen) have also helped support consumers instead of the usual household wealth effect, where rising rates lead to falling asset prices that constrain household wealth and ultimately consumer spending.
Finally, bank lending has been affected less than expected as the large fiscal deficit from recent stimulus bills is helping boost household incomes and corporate profits, unlike typical cycles where rising delinquencies and defaults lead banks to increase reserves and reduce lending.
To be sure, monetary policy works through “long and variable lags” in affecting the economy, but Atluri believes we should have already seen much more significant signs of stress in the most interest-rate-sensitive sectors of the economy. “If the transmission channels are impaired in the ways described above, it may help explain why economic growth has surprised to the upside and why the Fed may need to maintain restrictive policy for longer,” Atluri says.
Deficit-related spending likely to grow
The large fiscal deficit is likely to remain an important economic driver. The deficit could be lower in 2024 than it is today, but it still is expected to remain near record-high levels. The U.S. Congressional Budget Office (CBO) estimates that U.S. budget deficits will continue to expand from there as the Infrastructure Investment and Jobs Act (IIJA) and Inflation Reduction Act (IRA) take effect. And this could even be an underestimation as the CBO assumes previously implemented tax cuts will be reversed in-line with legislation. The reality is these assumptions have rarely been accurate.
Furthermore, the economic impact of upcoming fiscal spending could be even more dramatic as the composition of that spending changes. More money is earmarked to directly fund capital expenditures (capex), which has tended to operate with a multiplier effect on economic activity as it has a downstream impact on jobs, services and productivity growth.
U.S. federal deficit widens in 2023
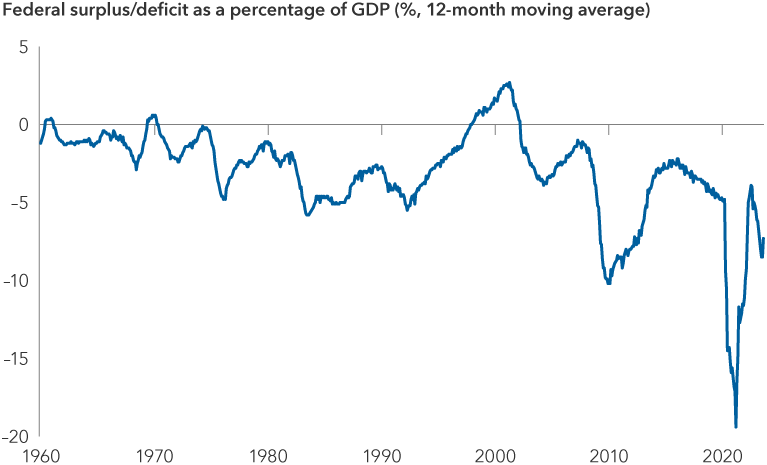
Source: U.S. Bureau of Economic Analysis. Data as of August 31, 2023.
Navigating a “higher-for-longer” world
With economic growth boosted by large fiscal deficits, interest rates could remain at levels the market has not been accustomed to seeing over the past 15 years. The 10-year U.S. Treasury could trade near the upper level of a range between 3.5% and 5.5% for an extended period as the Fed seeks to maintain growth consistent with inflation trending down to 2%.
Ultimately, financial markets may prove more volatile over the next few years even if underlying growth dynamics remain more stable. “Higher interest rates for longer will eventually be successful and growth will ultimately fall, but it may take more time than the market currently expects,” Atluri says. “This may keep volatility elevated as portfolios may once again have to reposition for yet another changing macro environment.” While volatility should lead to dislocations and attractive opportunities, investors may need to be cautious with the amount of risk they take.
Another scenario that could hurt the economy is the deficit falling quickly in the near term. “A large part of my thesis is that an 8% deficit is propping up growth and leading to higher-than-expected interest rates,” Atluri says. “But if the deficit should fall, this would have dramatic implications for the market.” Growth would likely decline, and the risk of recession would rise significantly.
In that scenario, Atluri believes the Fed would need to cut rates significantly to recalibrate monetary policy for an economy with a significantly smaller deficit. Given the large size of today’s fiscal deficit and its importance to both monetary policy and economic growth, investors need to remain vigilant on how it may evolve in the coming years.
The good news is that in a world where rates stay higher for longer, higher yields can offer attractive income and return potential, while also buffering potential price declines. What’s more, the price appreciation potential is meaningful should rates fall due to a sharper-than-expected slowdown or other external shock.
Learn more about
Quantitative tightening occurs when a central bank shrinks its balance sheet by selling securities or allowing them to mature and not be replaced.
A yield curve illustrates the yields on similar bonds across various maturity levels (such as U.S. Treasuries). An inverted yield curve is said to occur when yields on short-term bonds are higher than yields on long-term bonds. Yield curve steepening occurs when long-term rates rise more than short-term rates, or short-term rates fall more than long-term rates.
Our latest insights
-
-
Technology & Innovation
-
Demographics & Culture
-
-
Emerging Markets
RELATED INSIGHTS
-
Global Equities
-
Technology & Innovation
-
Demographics & Culture
Commissions, trailing commissions, management fees and expenses all may be associated with mutual fund investments. Please read the prospectus before investing. Mutual funds are not guaranteed, their values change frequently and past performance may not be repeated.
Unless otherwise indicated, the investment professionals featured do not manage Capital Group‘s Canadian mutual funds.
References to particular companies or securities, if any, are included for informational or illustrative purposes only and should not be considered as an endorsement by Capital Group. Views expressed regarding a particular company, security, industry or market sector should not be considered an indication of trading intent of any investment funds or current holdings of any investment funds. These views should not be considered as investment advice nor should they be considered a recommendation to buy or sell.
Statements attributed to an individual represent the opinions of that individual as of the date published and do not necessarily reflect the opinions of Capital Group or its affiliates. This information is intended to highlight issues and not be comprehensive or to provide advice. For informational purposes only; not intended to provide tax, legal or financial advice. We assume no liability for any inaccurate, delayed or incomplete information, nor for any actions taken in reliance thereon. The information contained herein has been supplied without verification by us and may be subject to change. Capital Group funds are available in Canada through registered dealers. For more information, please consult your financial and tax advisors for your individual situation.
Forward-looking statements are not guarantees of future performance, and actual events and results could differ materially from those expressed or implied in any forward-looking statements made herein. We encourage you to consider these and other factors carefully before making any investment decisions and we urge you to avoid placing undue reliance on forward-looking statements.
The S&P 500 Composite Index (“Index”) is a product of S&P Dow Jones Indices LLC and/or its affiliates and has been licensed for use by Capital Group. Copyright © 2024 S&P Dow Jones Indices LLC, a division of S&P Global, and/or its affiliates. All rights reserved. Redistribution or reproduction in whole or in part are prohibited without written permission of S&P Dow Jones Indices LLC.
FTSE source: London Stock Exchange Group plc and its group undertakings (collectively, the "LSE Group"). © LSE Group 2024. FTSE Russell is a trading name of certain of the LSE Group companies. "FTSE®" is a trade mark of the relevant LSE Group companies and is used by any other LSE Group company under licence. All rights in the FTSE Russell indices or data vest in the relevant LSE Group company which owns the index or the data. Neither LSE Group nor its licensors accept any liability for any errors or omissions in the indices or data and no party may rely on any indices or data contained in this communication. No further distribution of data from the LSE Group is permitted without the relevant LSE Group company's express written consent. The LSE Group does not promote, sponsor or endorse the content of this communication. The index is unmanaged and cannot be invested in directly.
BLOOMBERG® is a trademark and service mark of Bloomberg Finance L.P. and its affiliates (collectively “Bloomberg”). Bloomberg or Bloomberg’s licensors own all proprietary rights in the Bloomberg Indices. Neither Bloomberg nor Bloomberg’s licensors approves or endorses this material, or guarantees the accuracy or completeness of any information herein, or makes any warranty, express or implied, as to the results to be obtained therefrom and, to the maximum extent allowed by law, neither shall have any liability or responsibility for injury or damages arising in connection therewith.
MSCI does not approve, review or produce reports published on this site, makes no express or implied warranties or representations and is not liable whatsoever for any data represented. You may not redistribute MSCI data or use it as a basis for other indices or investment products.
Capital believes the software and information from FactSet to be reliable. However, Capital cannot be responsible for inaccuracies, incomplete information or updating of the information furnished by FactSet. The information provided in this report is meant to give you an approximate account of the fund/manager's characteristics for the specified date. This information is not indicative of future Capital investment decisions and is not used as part of our investment decision-making process.
Indices are unmanaged and cannot be invested in directly. Returns represent past performance, are not a guarantee of future performance, and are not indicative of any specific investment.
All Capital Group trademarks are owned by The Capital Group Companies, Inc. or an affiliated company in Canada, the U.S. and other countries. All other company names mentioned are the property of their respective companies.
Capital Group funds are offered in Canada by Capital International Asset Management (Canada), Inc., part of Capital Group, a global investment management firm originating in Los Angeles, California in 1931. Capital Group manages equity assets through three investment groups. These groups make investment and proxy voting decisions independently. Fixed income investment professionals provide fixed income research and investment management across the Capital organization; however, for securities with equity characteristics, they act solely on behalf of one of the three equity investment groups.
The Capital Group funds offered on this website are available only to Canadian residents.