Global Equities
Categories
Equity
5 reasons why equities could defy the odds
 Marc Nabi
 Maria Karahalis
 David Polak
March 6, 2024
The dominance of megacap tech stocks has prompted debate around how much higher equity markets can go, especially in the U.S. In our view, even accounting for the recent climb in stocks, overall valuations do not appear to be stretched. Global corporate earnings have bounced back from a near trough and are expected to improve further from here. Moreover, moderating inflation and declining interest rates could create a highly favorable backdrop. While we may see some volatility related to earnings, elections, the pace of interest rate cuts, or geopolitical events, we believe that equities are in a sweet spot, as we highlight in the charts below.
The year 2024 might not be exceptional for all the companies in the Magnificent 7. Nvidia continues to surge ahead of other companies given AI excitement, while Apple, Alphabet and Tesla shares are down thus far to begin 2024.
1. Earnings growth will be key driver for stocks
Forget the Oscars. Earnings season around the world has been a spectacle. Chipmaker Nvidia brought home the top prize, delivering a solid earnings beat and expanding its market capitalization by $277 billion on February 22. Meta was a runner-up, with its bottom line reflecting the benefits of cost-cutting efforts initiated a couple of years ago. Meta added almost $200 billion in market value on February 2, announcing a dividend for icing on the cake.
The blended earnings growth rate for the S&P 500 information technology sector rose 22.7% year over year, according to data compiled by FactSet. “Their valuations are rich, but they’re not stretched,” Capital Group chief investment officer Martin Romo told us recently. He referenced a broader group of technology companies, including the Magnificent Seven along with Broadcom, but made the point that one can’t ignore these companies as they’ll continue to impact markets and economies. Many of these firms are growing in a disciplined manner, and they’re getting operating leverage in a way they haven’t historically achieved, Romo says.
Earnings appear set to recover in 2024
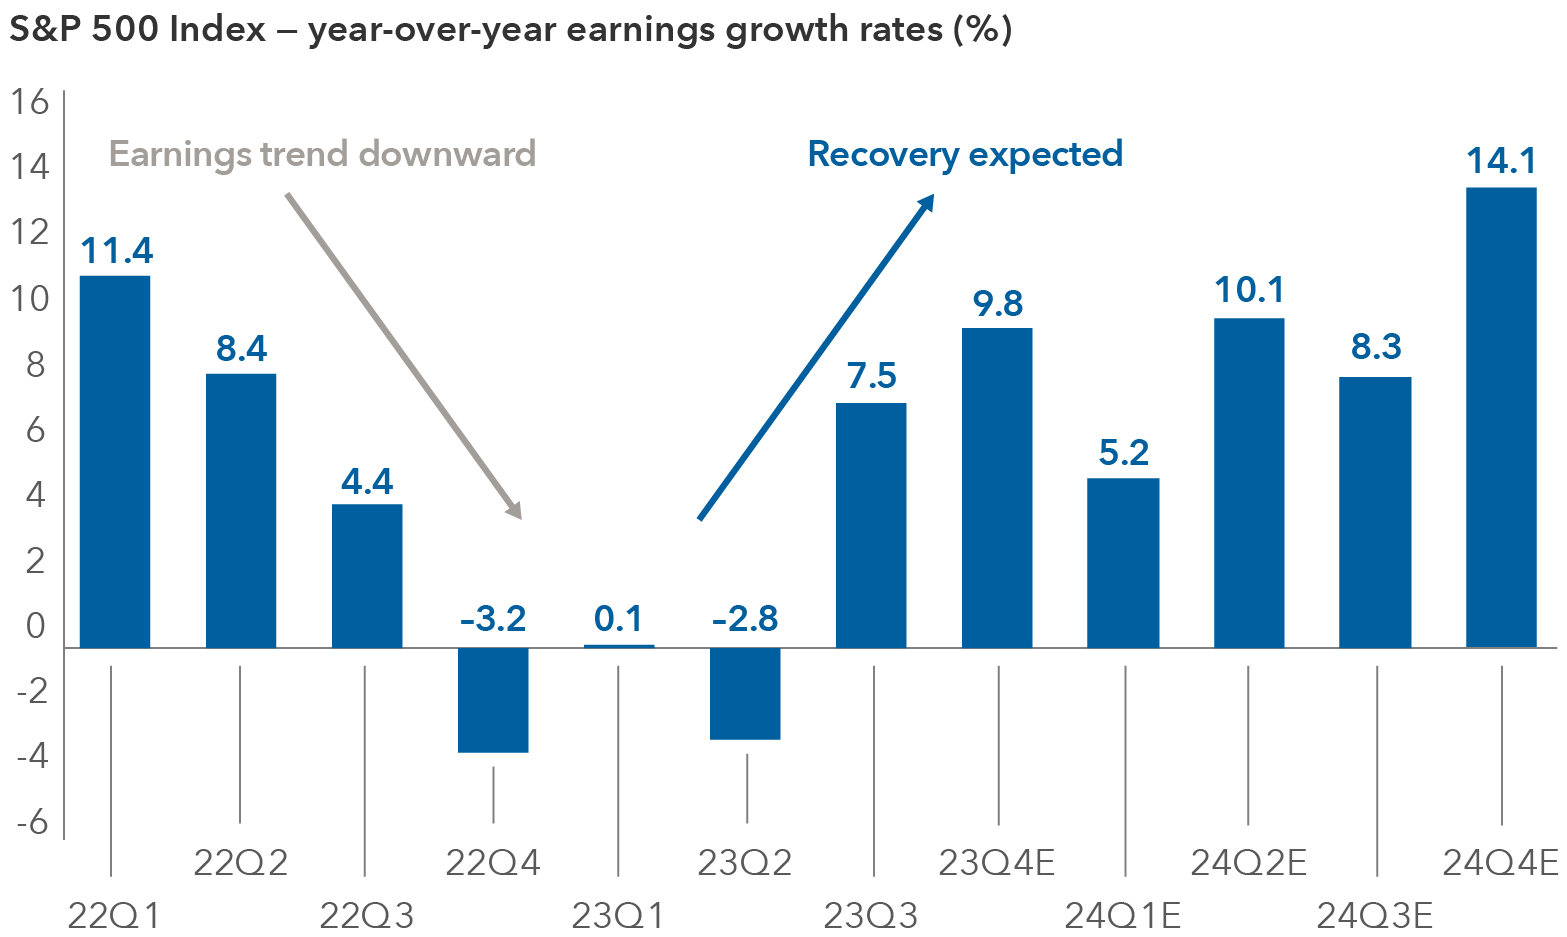
Source: LSEG Institutional Brokers' Estimate System. As of March 1, 2024. Actual data from the first quarter of 2022, until the fourth quarter of 2024. Estimates from the fourth quarter of 2023 until the third quarter of 2024. E = estimate.
Companies in the S&P 500 grew earnings by 9.8% in the fourth quarter of 2023 year over year, and consensus estimates for 2024 suggest a sustained earnings rebound. Seventy-six percent of S&P 500 companies beat earnings expectations in the fourth quarter, while 63% reported higher revenues than analysts anticipated, according to data compiled by LSEG.
Consensus analyst estimates for S&P 500 earnings anticipate a gain of over 11% in 2024 versus 0.8% in 2023. In emerging markets, consensus estimates are for almost 18% growth this year, compared to a decline of about 10% in 2023.
Portfolio manager Chris Buchbinder reminded us recently that “stocks will follow earnings, and earnings will follow fundamentals.” Buchbinder still sees relatively attractive opportunities in the market, though he expects earnings performance to vary among companies — especially among tech favorites, with exceptional businesses and management teams differentiating themselves from the pack.
Corporate earnings set to rebound
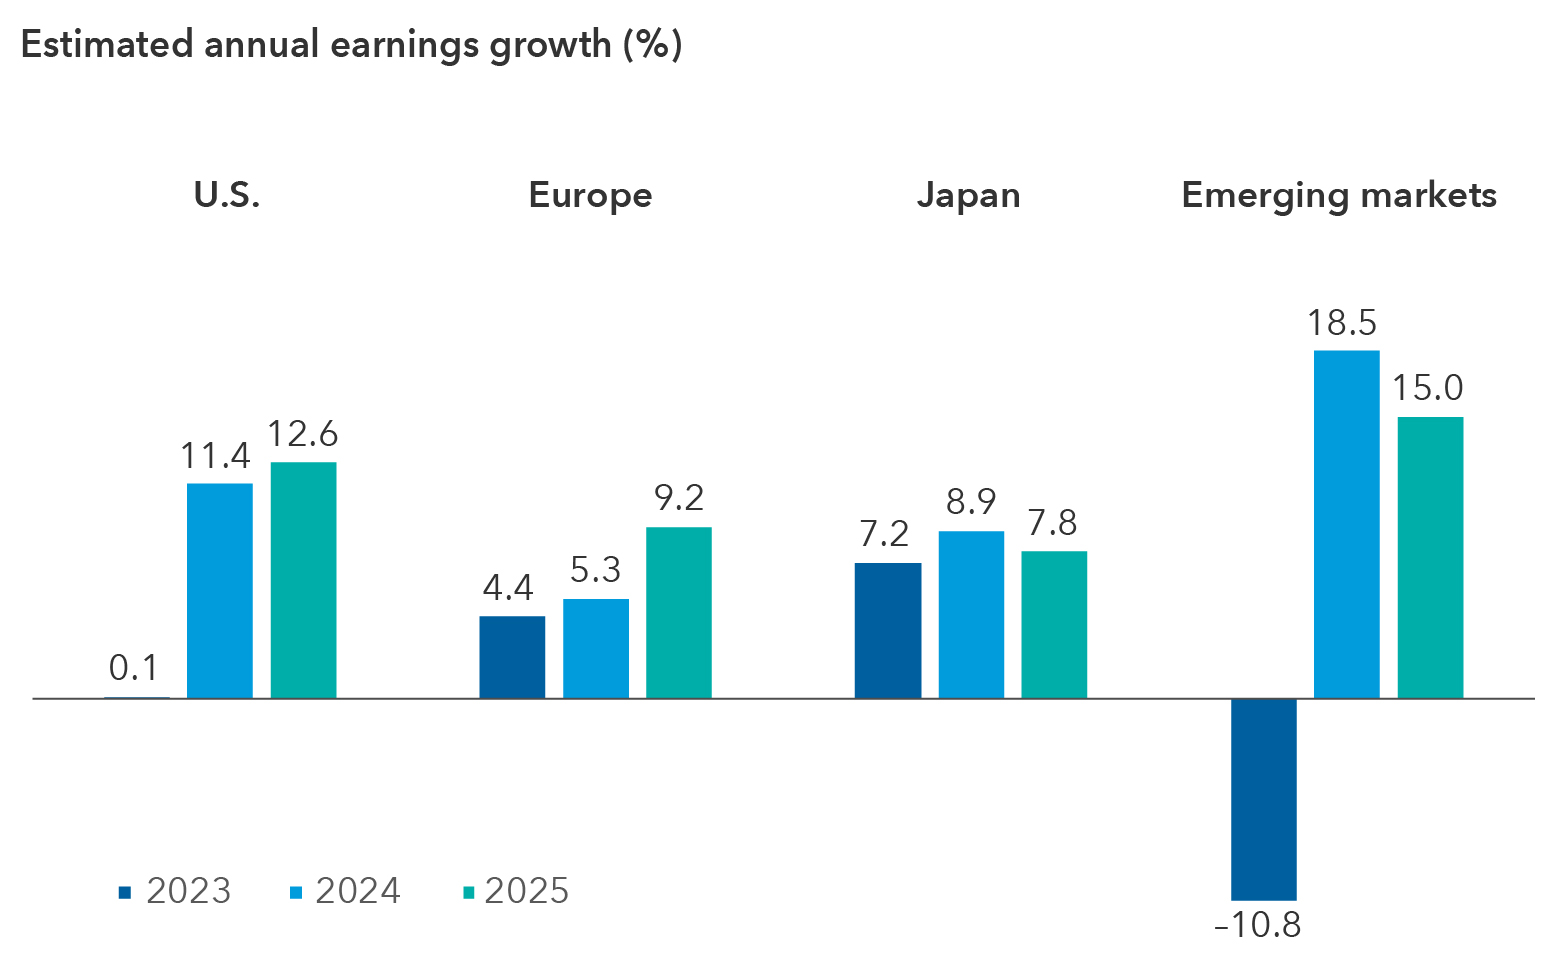
Sources: Capital Group, FactSet, MSCI, Standard & Poor's. The chart shows estimated earnings growth for each region. Estimated annual earnings growth is represented by the mean consensus earnings per share estimates for the years ending December 2023, December 2024 and December 2025. U.S. = S&P 500 Index. Europe = MSCI Europe Index. Japan = MSCI Japan Index. Emerging markets = MSCI Emerging Markets Index. Estimates as of December 31, 2023.
2. Despite their run-up, U.S. equity valuations don’t appear stretched
At first glance, valuations for a handful of S&P 500 sectors may appear on the rich side. But when looking at the range of P/E ratios on a 10-year basis for most sectors, there could still be some room to run. Earnings growth will be a key driver in determining if stocks continue moving higher, in contrast to the previous decade when multiple expansion and an ultra-low interest rate environment provided strong tailwinds. U.S. equity valuations don’t appear stretched given growth expectations, especially when factoring in recent earnings strength.
The economic backdrop in the U.S. also remains supportive, with a soft landing looking more likely than a recession. That said, we expect some bouts of market volatility amid ongoing jitters around the pace and magnitude of interest rate cuts and inflation readings. January’s higher-than-expected inflation figures, for instance, sparked concerns in the market about when the Fed may begin cutting rates. But as long as earnings growth continues to meet or exceed expectations and the labor market remains strong, U.S. equities should find support. Companies with clear earnings growth trajectories, pricing power and the ability to maintain market share should be able to weather potential storms.
U.S. equity valuations don’t appear to be stretched
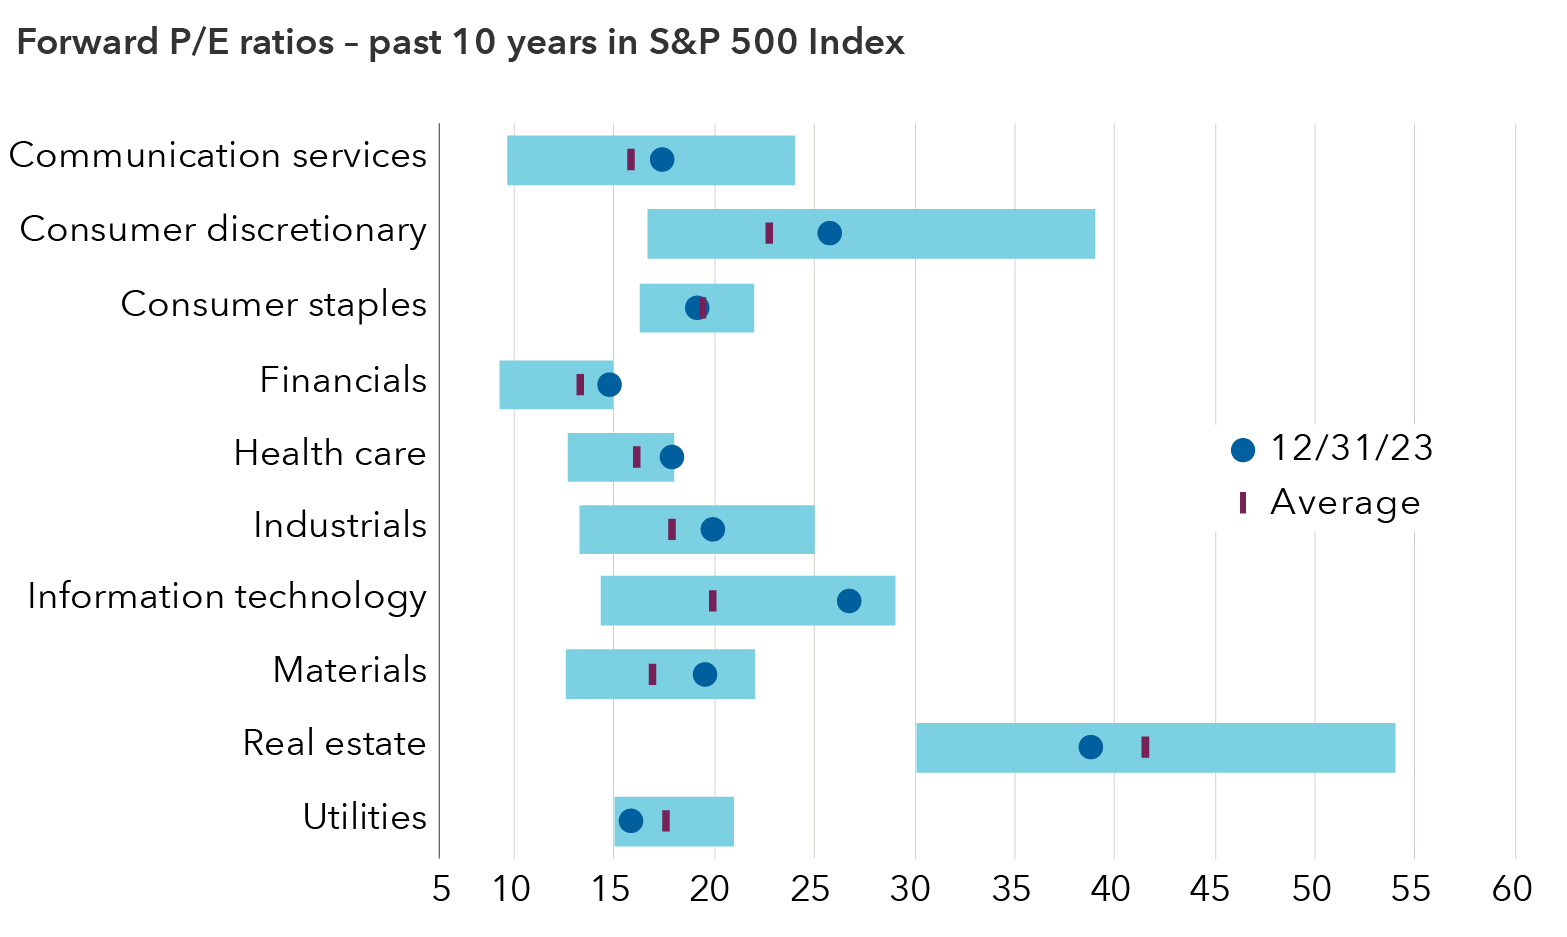
Sources: Capital Group, LSEG. Forward price-to-earnings ratio reflects the current share price relative to the consensus estimate for earnings per share on a 12-month forward basis. Data from December 31, 2013, through December 31, 2023. P/E = price-to-earnings. Past results are not predictive of results in future periods.
3. Global companies offer good value
At the high level, on a 12-month forward P/E basis, most of the industries in the ACWI Index appear to be attractively priced. Many are at or just above their 10-year average forward P/E ratio at a time when central banks around the world are set to ease monetary policy, and longer-term interest rates are likely to decline.
It’s worth highlighting here that the bull run in U.S. stocks over the past decade has boosted the U.S. companies’ weighting in the ACWI index to a lofty 63%, which in turn lifts prices and valuations for the index. Outside the U.S., stocks are more attractively priced – companies with strong franchises and global brands trade at a discount to their U.S peers.
Many European and Asian companies, for instance, have achieved strong market share in industries such as semiconductors, aerospace, pharmaceuticals and luxury goods. Expectations for lower rates in various non-U.S. markets may also provide a tailwind for global stocks.
In the U.S., higher share prices mean that valuations have also increased. “And so, we have looked a little bit more for better value in other areas,” said Jody Jonsson, vice chair and portfolio manager at Capital Group.
Most industries trade around 10-year average on price-to-earnings basis
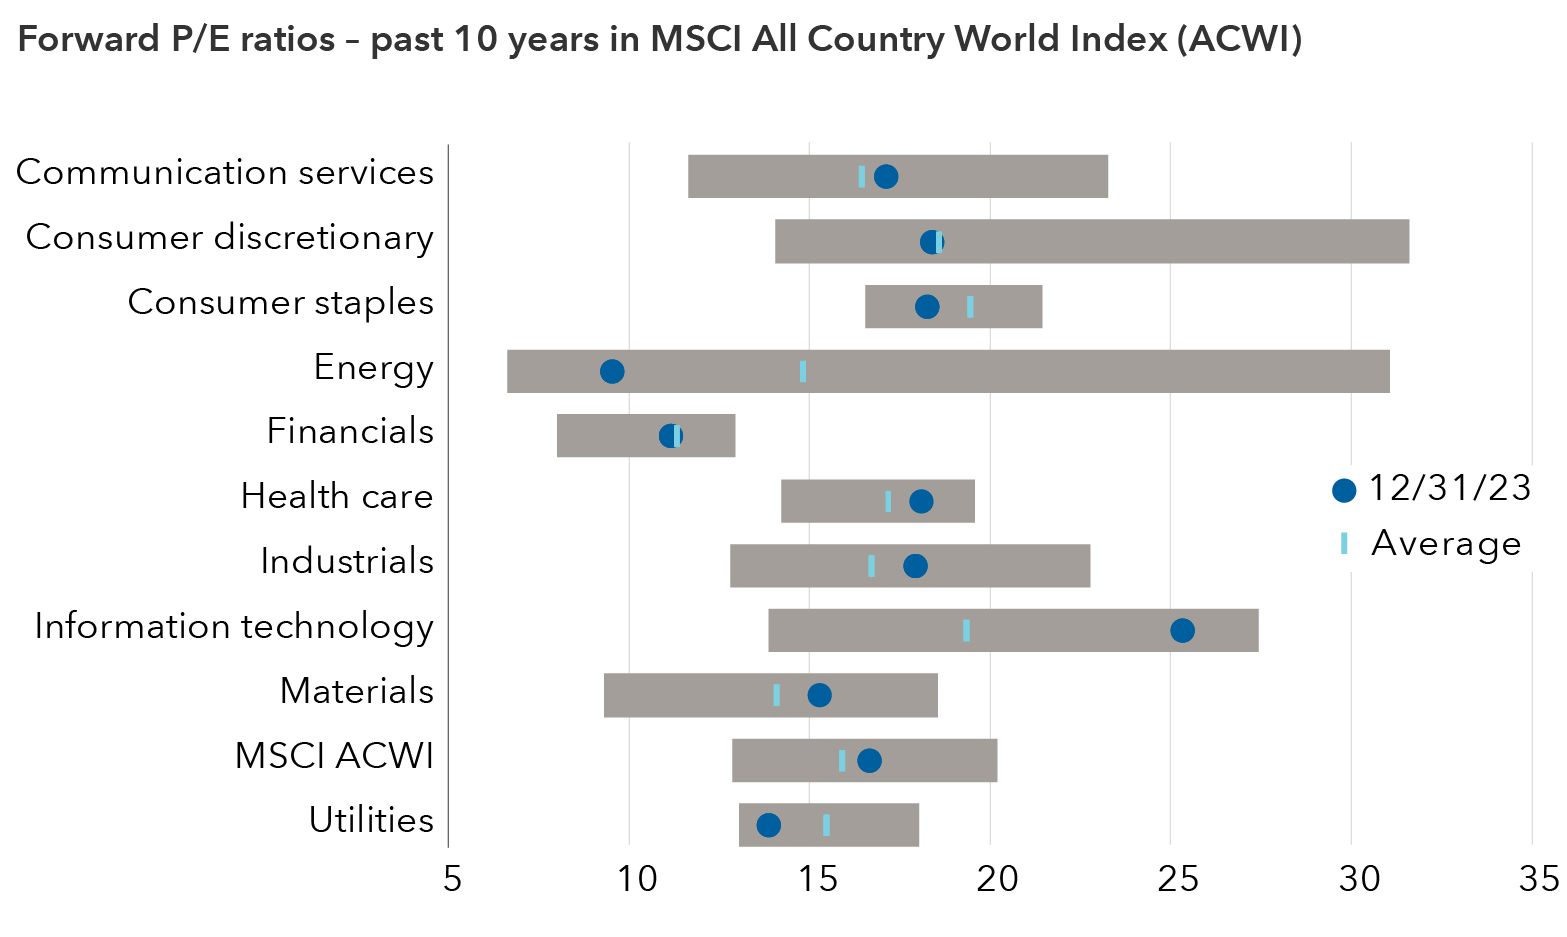
Sources: Capital Group, London Stock Exchange Group, MSCI. Forward price-to-earnings ratio reflects the current share price relative to the consensus estimate for earnings per share on a forward 12-month basis. Data from December 31, 2013, through December 31, 2023. P/E = price-to-earnings. Past results are not predictive of results in future periods.
Japan, the world's top-returning global equity market year to date (as of February 29), as measured by the MSCI Japan Index, is drawing interest given long-awaited equity market and corporate governance reforms. Meanwhile, emerging markets such as India and Mexico may benefit from reconstructed global supply chains as their new manufacturing hubs develop smartphones, automobiles, home appliances and computer electronics. “Despite China’s slowing economy, I think durable trends – including demographic shifts and the energy transition – could add more depth to emerging markets than we have seen in the past,” portfolio manager Brad Freer said.
4. There are pockets of strength emerging beyond the Magnificent 7
Despite eye-popping returns in 2023, the Magnificent 7 look less impressive over a slightly longer time horizon. In the two years from the start of 2022 through 2023, only one of the Magnificent 7 ranked among the top-returning companies in the S&P 500 Index due to severe drawdowns in 2022.
While one can argue that tech’s premium valuations are justified given their strong earnings and new growth runway in artificial intelligence, the chart shows a broader number of S&P 500 constituents posted relatively strong returns in areas such as energy, health care and industrials.
As earnings growth recovers in non-tech sectors, we could see a more diverse set of companies garner investor attention. To dampen portfolio concentration risk, an asset allocation program may want to seek greater diversification by reducing overall exposure to technology companies and U.S. equities.
Diversification can pay off despite Magnificent 7 exuberance
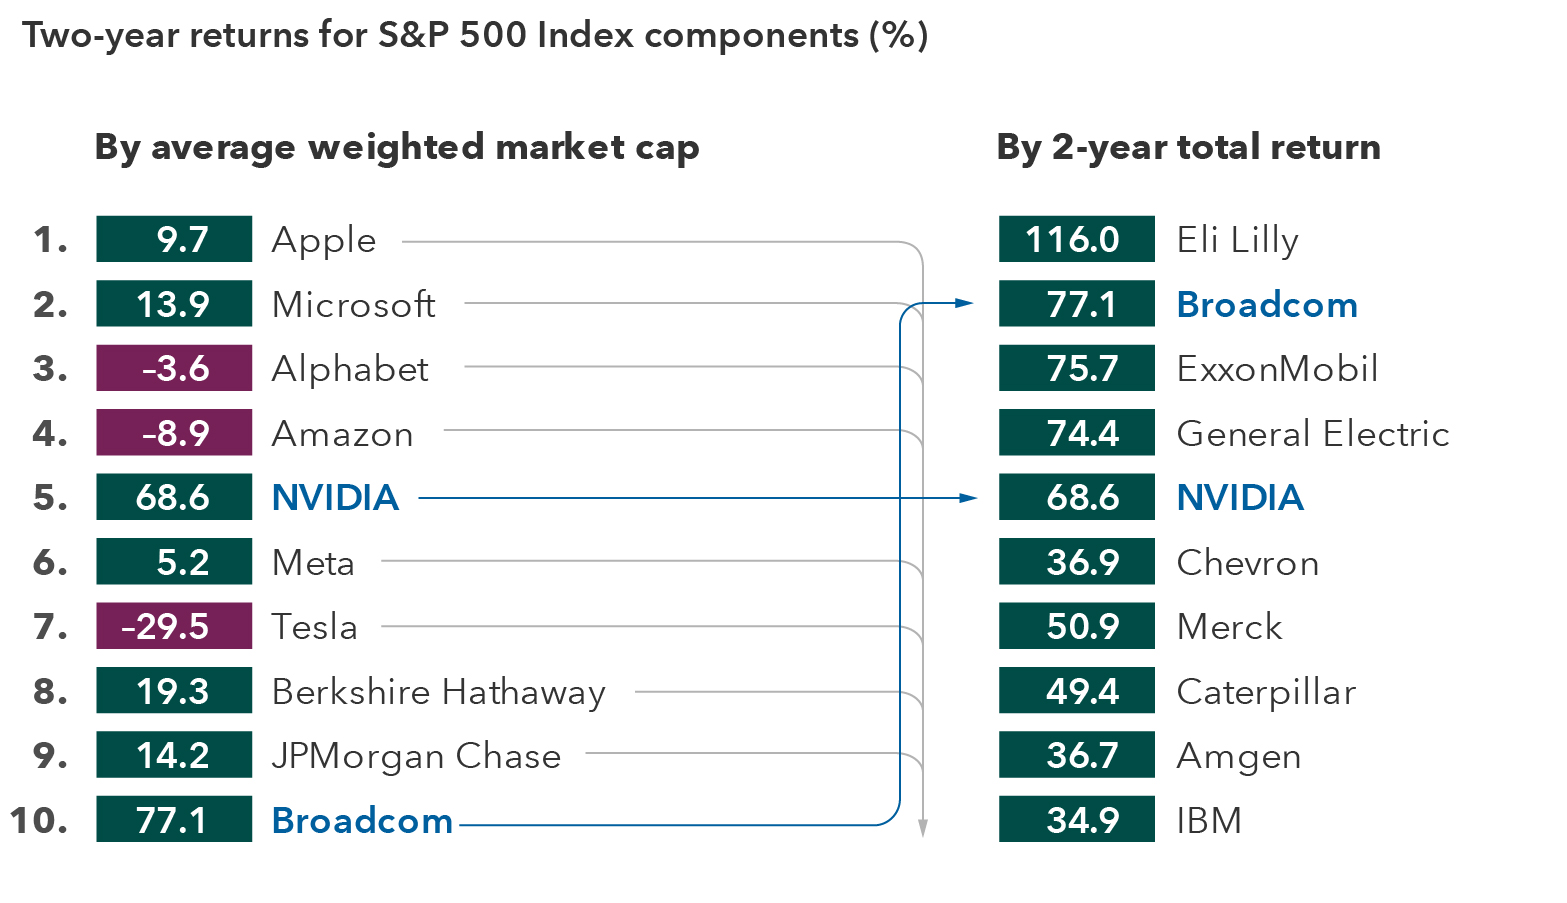
Source: FactSet. Data is based on the 55 most heavily weighted companies in the S&P 500 Index and filtered by the top 10 by average weight and total returns. Data as of December 31, 2023. The returns are shown from January 1, 2022, through December 31, 2023.
5. Rising cash flows could provide further support
At an aggregate level, companies in the S&P 500 Index excluding financials are holding cash at levels that are near 10-year highs. This could fuel stock buybacks, M&A activity or dividend payments. For instance, over the last few months, there has been an increase in M&A activity among some larger oil and pharmaceutical companies, deals that could help drive long-term earnings growth. Companies have also been increasing their dividend payouts, which contribute to total stock returns. Recent high-profile examples are Meta and Salesforce announcing their first-ever dividends, which bode well for capital allocation discipline.
Capital expenditures will no doubt be on the rise to meet the needs of technology companies, including the large investment in data centers required for AI, but also for the infrastructure investment needed to support the reshoring of supply chains. This investment should translate into steady cash flow growth for a broad array of companies across many sectors.
Free cash flow continues to climb
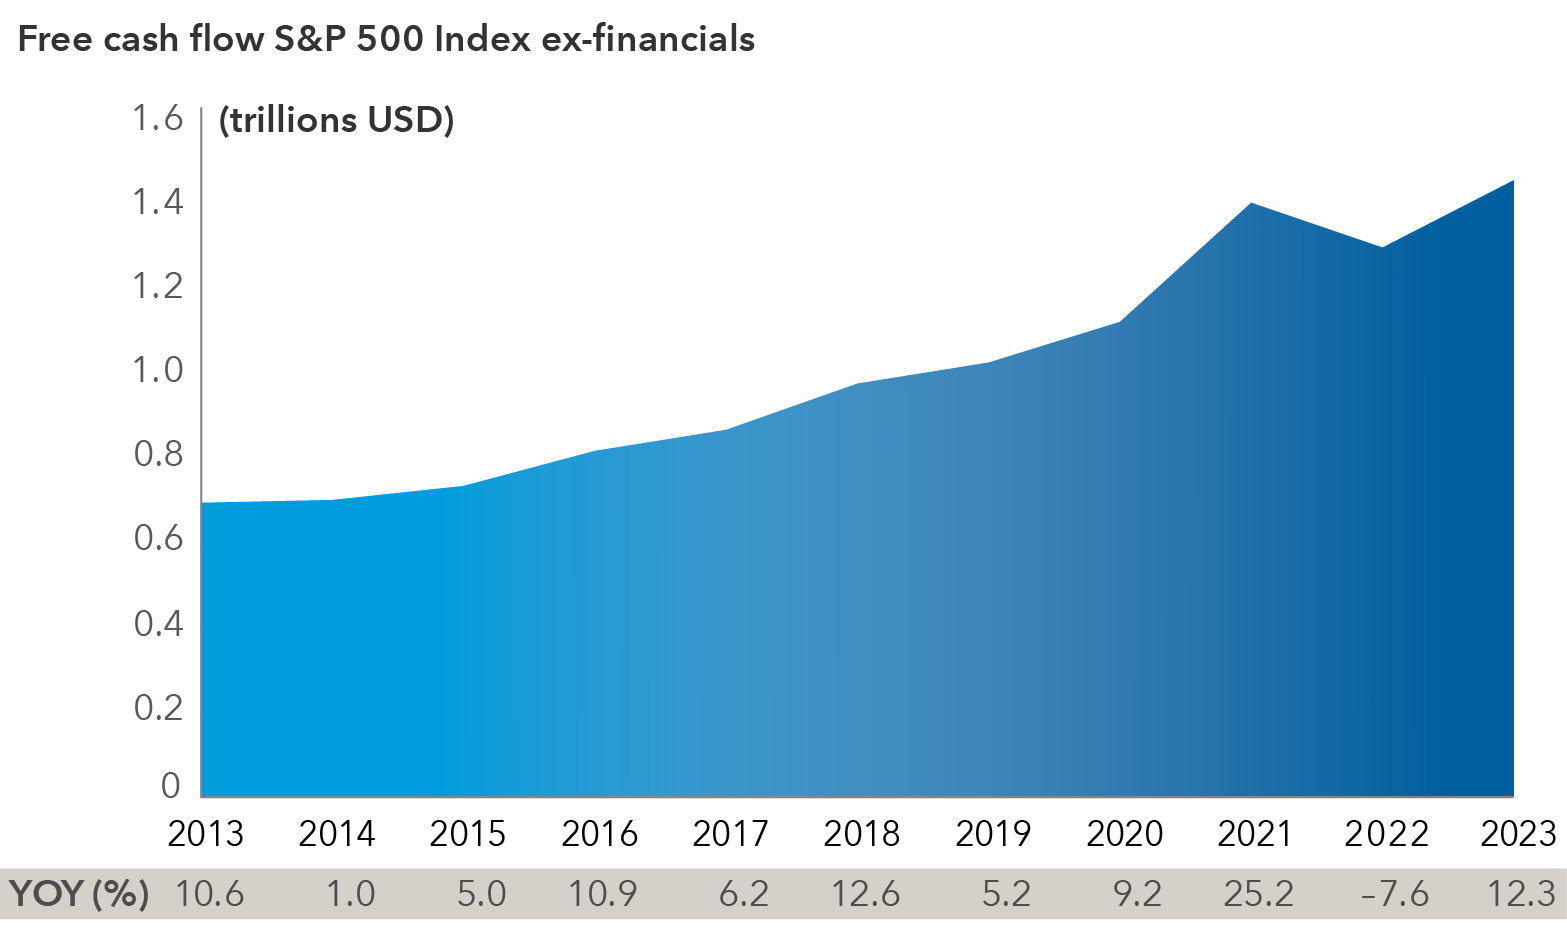
Source: Capital Group. Data from 2013 to 2023.
When looking at free cash flow, corporate America appears healthy. As our colleague, accounting analyst Dane Mott, reminds us, free cash flow (FCF) isn’t a perfect metric because it excludes M&A activities, but it still gives you a good indicator of corporate health. “Looking at FCF numbers for non-financial companies in the S&P 500 Index in 2023, they were the highest numbers ever recorded at nearly $1.5 trillion, and they grew at a healthy 12.3% year over year,” Mott said. A valuation metric often used by investors is the market cap to free cash flow ratio, which was 26.4x at the end of 2023, compared to 52x at the height of the dot-com bubble in 1999.
Overall, despite various equity market indices testing recent highs, we believe that the fundamentals and the macroeconomic backdrop for equities remain robust. We may hit some air pockets because of economic or geopolitical events and domestic election year uncertainty. Selectivity will be key, yet we remain optimistic.
Learn more about
The S&P 500 Index is a market-capitalization-weighted index based on the results of approximately 500 widely held common stocks.
The S&P 500 Information Technology Index comprises those companies included in the S&P 500 that are classified as members of the GICS® information technology sector.
MSCI All Country World Index (ACWI) is a free-float-adjusted market-capitalization-weighted index that is designed to measure equity market results in the global developed and emerging markets, consisting of more than 40 developed and emerging market country indexes.
The MSCI Europe Index captures large and mid-cap representation across 15 Developed Markets (DM) countries in Europe.
The MSCI Emerging Markets Index captures large and mid-cap representation across 24 Emerging Markets (EM) countries.
The MSCI Japan Index is designed to measure the performance of the large and mid-cap segments of the Japanese market.
BLOOMBERG® is a trademark and service mark of Bloomberg Finance L.P. and its affiliates (collectively “Bloomberg”). Bloomberg or Bloomberg’s licensors own all proprietary rights in the Bloomberg Indices. Neither Bloomberg nor Bloomberg’s licensors approves or endorses this material, or guarantees the accuracy or completeness of any information herein, or makes any warranty, express or implied, as to the results to be obtained therefrom and, to the maximum extent allowed by law, neither shall have any liability or responsibility for injury or damages arising in connection therewith.
Free cash flow (FCF) – The remaining money available to a company after it has paid its operating expenses and capital expenditures. The more free cash flow a company has, the more it can use to repay creditors, pay dividends and for growth opportunities.
Average weighted market capitalization refers to a market index (e.g., S&P 500) in which each component is weighted according to the size of its total market capitalization.
The S&P 500 Index is a product of S&P Dow Jones Indices LLC and/or its affiliates and has been licensed for use by Capital Group. Copyright © 2024 S&P Dow Jones Indices LLC, a division of S&P Global, and/or its affiliates. All rights reserved. Redistribution or reproduction in whole or in part are prohibited without written permission of S&P Dow Jones Indices LLC.
Don't miss our latest insights.
Our latest insights
-
-
Markets & Economy
-
Emerging Markets
-
Chart in Focus
-
Global Equities
RELATED INSIGHTS
-
Artificial Intelligence
-
Technology & Innovation
-
World Markets Review
Don’t miss out
Get the Capital Ideas newsletter in your inbox every other week
Investments are not FDIC-insured, nor are they deposits of or guaranteed by a bank or any other entity, so they may lose value.
Investors should carefully consider investment objectives, risks, charges and expenses.
This and other important information is contained in the fund prospectuses and summary prospectuses, which can be obtained from a financial professional and should be read carefully before investing.
Past results are not predictive of results in future periods.
Investing outside the United States involves risks, such as currency fluctuations, periods of illiquidity and price volatility. These risks may be heightened in connection with investments in developing countries.
There may have been periods when the results lagged the index(es) and/or average(s).
The indexes are unmanaged and, therefore, have no expenses. Investors cannot invest directly in an index.
MSCI has not approved, reviewed or produced this report, makes no express or implied warranties or representations and is not liable whatsoever for any data in the report. You may not redistribute the MSCI data or use it as a basis for other indices or investment products.
Statements attributed to an individual represent the opinions of that individual as of the date published and do not necessarily reflect the opinions of Capital Group or its affiliates. This information is intended to highlight issues and should not be considered advice, an endorsement or a recommendation.
All Capital Group trademarks mentioned are owned by The Capital Group Companies, Inc., an affiliated company or fund. All other company and product names mentioned are the property of their respective companies.
Use of this website is intended for U.S. residents only.
American Funds Distributors, Inc.
This content, developed by Capital Group, home of American Funds, should not be used as a primary basis for investment decisions and is not intended to serve as impartial investment or fiduciary advice.