Fixed Income
 Karl Zeile
 Courtney Wolf
A dramatic shift in the inflation and interest rate landscape has led to significant weakness in the municipal bond market in recent weeks. Municipal bonds in aggregate posted negative returns in the first quarter. Where and how does this market present opportunity today? Karl Zeile and Courtney Wolf, portfolio managers for our municipal core bond portfolios, including the Tax-Exempt Bond Fund of America®, discuss five portfolio themes, their views on current market dynamics as well as their approach to investing.
1. Maintain liquidity and a nimble approach amid elevated volatility
The investment environment has changed significantly over the course of 2022. Russia’s invasion of Ukraine and expanded COVID-19 lockdowns in China have further aggravated already constrained global supply chains. With inflationary pressures continuing to build, the Federal Reserve has signaled an aggressive path of monetary tightening through a series of short-term interest rate increases. As capital markets adjust to tightening financial conditions and the removal of accommodative monetary policy, we expect market volatility to remain elevated over the next six to 12 months.
In this environment, we are maintaining liquidity and are being agile in adjusting portfolios in light of this higher price and spread volatility. We also believe there is value in taking a cautious approach to both credit and rates risk in our portfolios.
Municipal bond market volatility has been driven by rising rates, high inflation
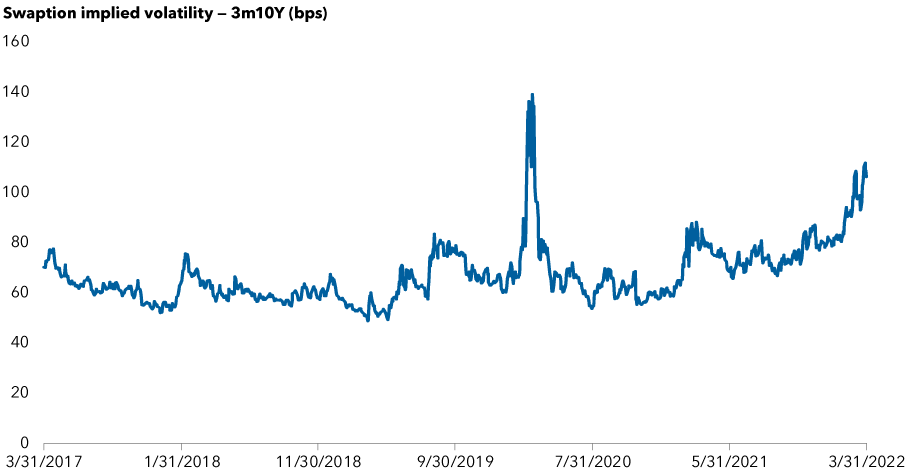
Source: Bloomberg Index Services, Ltd. Data as of 3/31/2022. Swaption-implied volatility provides a forward-looking gauge of interest rate volatility. A 3m10Y swaption expires in 3 months and is valued based on the price of a 10-year swap at expiry. The chart shows a sharp rise in volatility in the municipal bond market so far in 2022, as the Federal Reserve has increased short-term interest rates in an attempt to lower decades-high inflation levels. In March 2020, the municipal bond market suffered the highest volatility levels of the past five years due to the onset of the COVID-19 pandemic. Volatility levels had remained below the average level until early in 2022, when they began to rise above the “100” level, and have risen further so far this year.
2. Short duration and a further flattening of the yield curve
We favor a neutral-to-short-duration posture, given the current interest rate environment. (Duration measures how much a bond’s price changes if interest rates fluctuate, so a lower duration limits the effects of increasing rates.) Our outlook for U.S. rates includes rising short-term rates while long-term rates should fluctuate in a range, likely leading to a further flattening of the yield curve. Municipal bond yields typically move directionally with Treasury rates but with dampened volatility. More recent market trends have undercut that traditional relationship, with muni-to-Treasury ratios meaningfully cheapening across the yield curve. Ratios for maturities inside of five years have almost doubled from their recent lows and are now around 70%.
Looking ahead, we expect municipal bonds to trade roughly in line with Treasuries. As a result, in core municipal bond portfolios, we are generally neutral to slightly long municipal bonds and are using Treasuries to shorten the portfolio durations relative to their benchmark.
Municipal bond curves have been “bear flattening” — a phenomenon in which short-term interest rates rise faster than long-term interest rates — since the Fed adopted a more hawkish posture. As the Fed considers how aggressively to raise the Fed Funds rate (the interest rate that the Federal Reserve directly controls) and remove other accommodations, market participants are expressing confidence in the Fed’s ability to dampen inflation pressures. These dynamics typically lead to a flatter rate curve.
At the same time, there are fewer catalysts for a steeper yield curve. Longer term inflation expectations are currently well-anchored, and the key drivers of recent economic growth are likely to dissipate moving forward. Fiscal stimulus is in its last phase, and a tight labor market could limit employment-driven economic activity.
The municipal bond yield curve continues to flatten
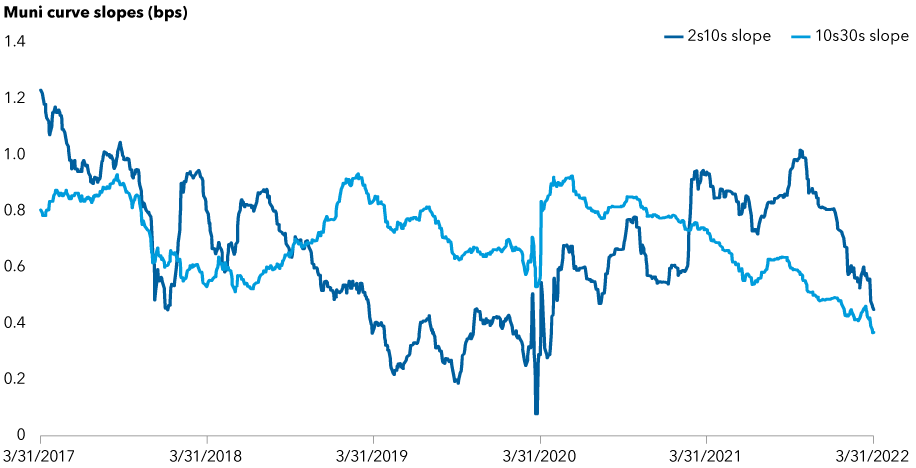
Source: Bloomberg Index Services, Ltd. Data as of March 31, 2022. 2s10s slope shows the difference in yields between bonds with 2- and 10-year maturities in the Bloomberg Municipal Bond Index. 10s30s slope shows the difference in yields between bonds with 10- and 30-year maturities in the Bloomberg Municipal Bond Index. Both series show the lowest levels of the past five years in March 2020, during a period of volatility in the early days of the COVID-19 pandemic, when shorter term and longer term rates converged. After returning to more normalized levels later in 2020 and toward the end of 2021, both lines show a decrease in slope from the end of 2021 into 2022. The decline indicates that the yield curve has flattened, reflecting that shorter term rates have risen compared with longer term rates as the Federal Reserve has begun raising interest rates.
3. Preference for higher coupon bonds
Investing in higher coupon bonds has been another expression of our preference for a shorter duration positioning in our portfolios and serves as a way to mitigate volatility. Adding callable higher coupon bonds at significant premiums has the potential to provide attractive income with less duration and a more stable ride for investors as yields rise. For example, a 30-year, 5% coupon bond that’s callable in 10 years has less sensitivity to rate moves than lower coupon 30-year bonds and offers more yield than a similar duration 10-year bullet bond, a type of bond for which the entire principal value is paid in one lump sum on its maturity date. Essentially, the strategy seeks to take advantage of an upwardly sloping municipal yield curve and earning income from the higher coupons without the duration risk associated with similar Treasury bonds.
Given the low interest rate environment, the past few years have witnessed a larger than normal volume of issuance in 4% and 3% coupon bonds that are callable in 10 years. These bonds tend to have a higher duration, given their lower coupons, and they have a higher representation in the market benchmark than they have in the past. Coupon and call structure positioning gives us another venue to take an active view relative to the Bloomberg Municipal Bond Index.
4. Favor revenue bonds over general obligation bonds
We believe our extensive credit research effort and focus on relative value allow us to make revenue bonds a key foundation of our portfolios that can benefit from the extra yield without sacrificing credit quality. It’s a preference we’ve had for several years, and we expect it to continue.
Importantly, the significant fiscal stimulus of the past few years has provided a boost to a large cross section of the municipal bond landscape, including direct aid to many states. This has led to meaningful improvement in credit quality among general obligation bond issuers in recent years. This is partly a result of issuers using fiscal stimulus funds to improve their balance sheets and overall financial condition. States such as New Jersey, Illinois and California have utilized the funds to improve their budgets, fund infrastructure and build reserves, all leading to improved credit strength.
While the majority of fiscal stimulus has been spent, there continues to be a tail of fiscal allocations in the system that is expected to amount to nearly 2% of gross domestic product in the coming year. A significant amount of stimulus gets dedicated to providing social safety nets through the public health system and via infrastructure, both of which flow through revenue bond issuers in the municipal bond market. The point is that there has been significant improvement in credit quality across the municipal bond market, partly as a result of issuers using fiscal stimulus funds to improve their balance sheets and overall financial condition.
Municipal bond spreads continue to tighten across credit quality
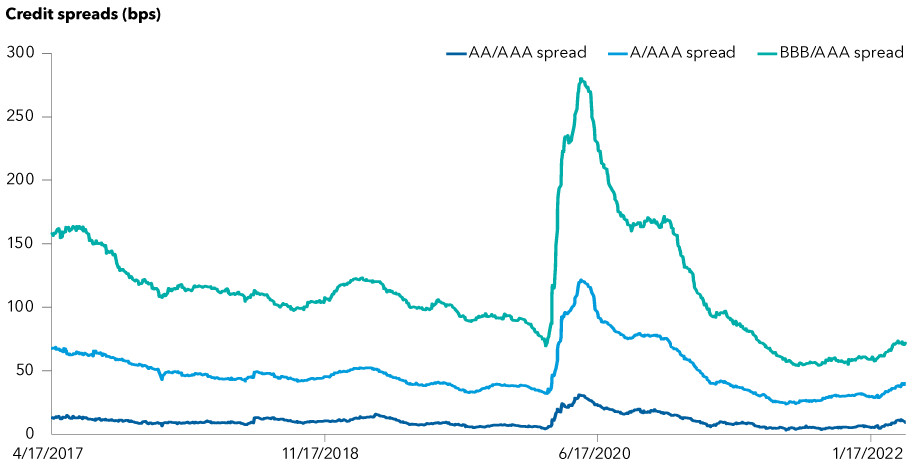
Source: Bloomberg Index Services, Ltd. Data as of March 31, 2022. AA/AAA Spread represents the spread between the Bloomberg Municipal AA Index and the Bloomberg Municipal AAA Index on a yield-to-worst basis. A/AAA Spread represents the spread between the Bloomberg Municipal A Index and the Bloomberg Municipal AAA Index on a yield-to-worst basis. BBB/AAA Spread represents the spread in bps between the Bloomberg Municipal Baa Index and Bloomberg Municipal AAA Index on a yield-to-worst basis. A rating of Baa is equivalent to the BBB rating range used by Fitch and S&P. Yield to worst is the lowest yield that can be realized by either calling or putting on one of the available call/put dates, or holding a bond to maturity. The first line shows the spread between the Bloomberg Municipal AA Index and the Bloomberg Municipal AAA Index on a yield-to-worst basis. The second line shows the spread between the Bloomberg Municipal A Index and the Bloomberg Municipal AAA Index on a yield-to-worst basis. The third line shows the spread between the Bloomberg Municipal Baa Index and Bloomberg Municipal AAA Index on a yield-to-worst basis. The chart shows that spreads for all three data series spiked in March 2020, during the early days of the COVID-19 pandemic, before tightening in time periods since that point.
5. Take advantage of select sector opportunities
The supportive credit backdrop provides a favorable environment to identify relative value credit opportunities.
For example, the health care sector experienced meaningful spread volatility throughout the pandemic period as investors weighed both the near-term and long-term impacts on hospital systems. Supported by meaningful federal aid and robust balance sheets, many higher credit quality systems navigated the past two years well and are positioned to benefit from a return to normal. Separating the winners from the losers as we move forward requires constant focus on both idiosyncratic and sector-wide considerations, including wage pressures and competition.
The transportation sector is poised to continue rebounding as economic conditions normalize.
While credit fundamentals are generally robust, the recovery experienced by some transportation segments has varied as a result of their revenue mix. We expect opportunities in mass transit, airports and toll roads to emerge moving forward. Mass transit systems seem positioned to benefit from ongoing normalization in economic activity and the essentiality of their service to their respective cities. Airports are expected to rely on a rebound in passenger traffic. Finally, toll roads should experience similar dynamics, but the systems exposed to commercial traffic could benefit the most. In all cases, we are focusing on idiosyncratic issuer-level trends and credit quality as we build portfolios one bond at a time. Generating superior excess returns in this type of market will require ongoing diligence and focus to identify key sector trends and those issuers representing the best relative value opportunity.
It is also important to layer our analysis of these opportunities within the framework of persistent inflation. For example, toll roads benefit from relatively fixed costs and rising toll revenues in an inflationary environment. On the other hand, health care companies face rising costs for labor and other inputs.
Broad yield dispersion creates opportunities within sectors
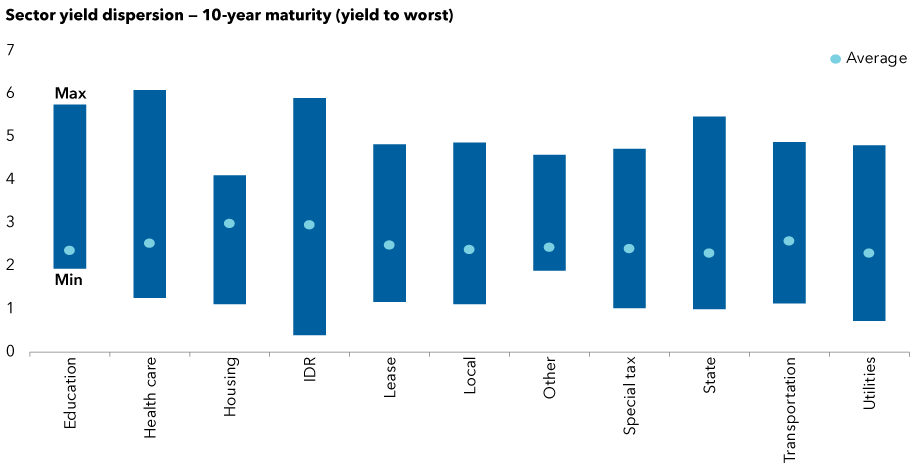
Source: Bloomberg Index Services, Ltd. Data as of March 31, 2022. IDR refers to industrial revenue bonds. Yield to worst is the lowest yield that can be realized by either calling or putting on one of the available call/put dates, or holding a bond to maturity. The chart shows the dispersion — a measurement of the difference between maximum and minimum levels — of yields between various sectors within the municipal bond market, as well as the average dispersion within each sector. Yields are represented by “yield to worst,” which reflects the lowest yield that can be realized by either calling or putting on one of the available call/put dates, or holding a bond to maturity. Across all sectors, the dispersion levels are significantly higher than their long-term averages.
Credit quality is another area that presents opportunity, though it has the potential for valuation gaps to close quickly. For instance, at current spread levels, single-A-rated credits represent greater value than higher quality credits, and we have been exploring adding to investments in this area, provided valuations remain supportive. Maintaining discipline in issuer selection will always be important.
Overall, the repricing of the municipal bond curve in recent weeks has opened areas of opportunity and boosted the relative value of municipal bonds relative to other fixed income asset classes. We remain very active and nimble in portfolios amid volatility in financial markets.
Stay informed with our latest insights.
Our latest insights
RELATED INSIGHTS
-
-
Interest Rates
-
Municipal Bonds
Don’t miss out
Get the Capital Ideas newsletter in your inbox every other week