Defined Contribution


This article is part of our Retirement Plan Trends series, which explores issues affecting the retirement space.
While the stock market and individual stock names usually grab the attention of the public with their headlines and dramatic stories, the fixed income market doesn’t usually provide much by way of surprises. But quietly over time, the Bloomberg U.S. Aggregate (Agg) Index, the primary benchmark for most defined contribution (DC) core bond strategies, arguably has become less diversified. The index’s composition has changed considerably since just after the great financial crisis. U.S. Treasuries now make up 42% of the index, up from 28% in 2009. In addition, rising interest rates and a decline of 13 percent for the Agg Index in 2022 have combined to be significant developments in the bond market, sparking some DC plan sponsors to review how they offer fixed income options in their investment menus.
Core bonds in today’s DC menus
DC menus are designed to provide the appropriate building blocks and solutions for participants to either select or create a portfolio to meet their particular investment objectives. DC participants are allocating to fixed income to achieve objectives such as income, inflation protection, diversification from equities and capital preservation, but the balance of those goals changes depending on a participant’s timeline to retirement. Of the 15–20 options typically offered (target date series would be counted as one option), perhaps only 3–4 options might be fixed income, including stable value or money market. In reality, fixed income options in DC plans are dominated by core fixed income, which is most often benchmarked to the Bloomberg U.S. Aggregate Index, according to Capital Group’s 2023 Institutional Retirement Survey of Plan Sponsors (coming soon).
Relative to the universe of opportunities within fixed income, thinking beyond core could add significant value. Over the past 20 years, there has been considerable differentiation among the results of fixed income sectors.
Fixed income sector returns have varied significantly
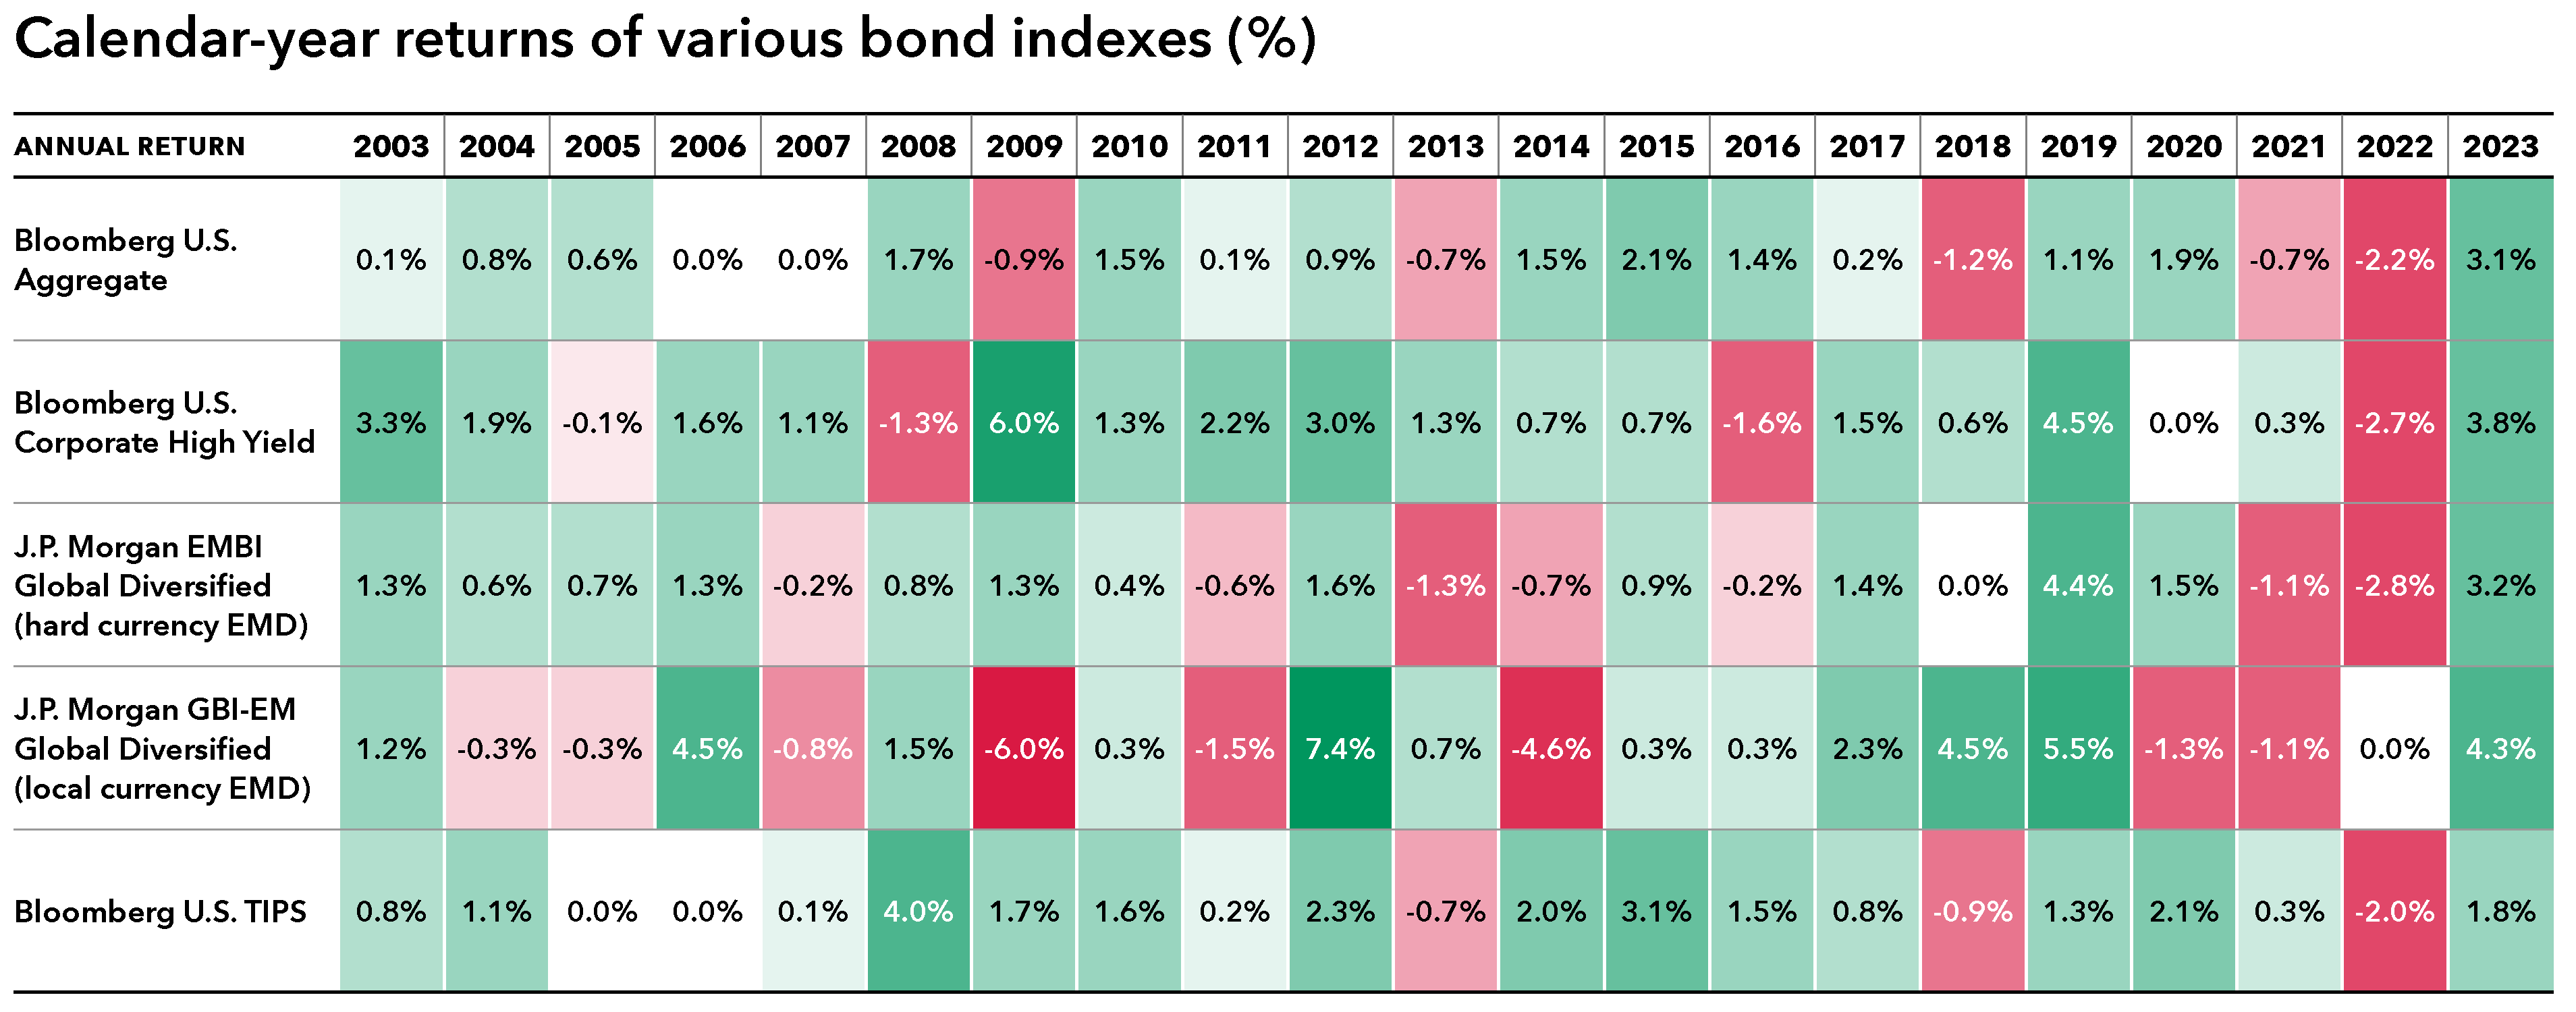
Source: Bloomberg. As of 12/31/23. Past results are not predictive of results in future periods.
Sectors like high-yield debt (BB/Ba and below) and emerging market debt have the potential to impact a fixed income portfolio’s return, yield and risk metrics. With the change in the rate environment, industry-wide capital market expectations have also significantly changed. Higher yields mean fixed income potentially may offer higher expected returns than in the previous decade while continuing to provide lower risk (standard deviation) than equities, and diverse characteristics. With this change in expectations, different fixed income strategies have the potential to be utilized more effectively to align with a portfolio objective. For example, with higher starting yields, below investment-grade and emerging market debt may provide enhanced levels of income in a portfolio context.
High-yield and emerging markets debt have offered a yield advantage
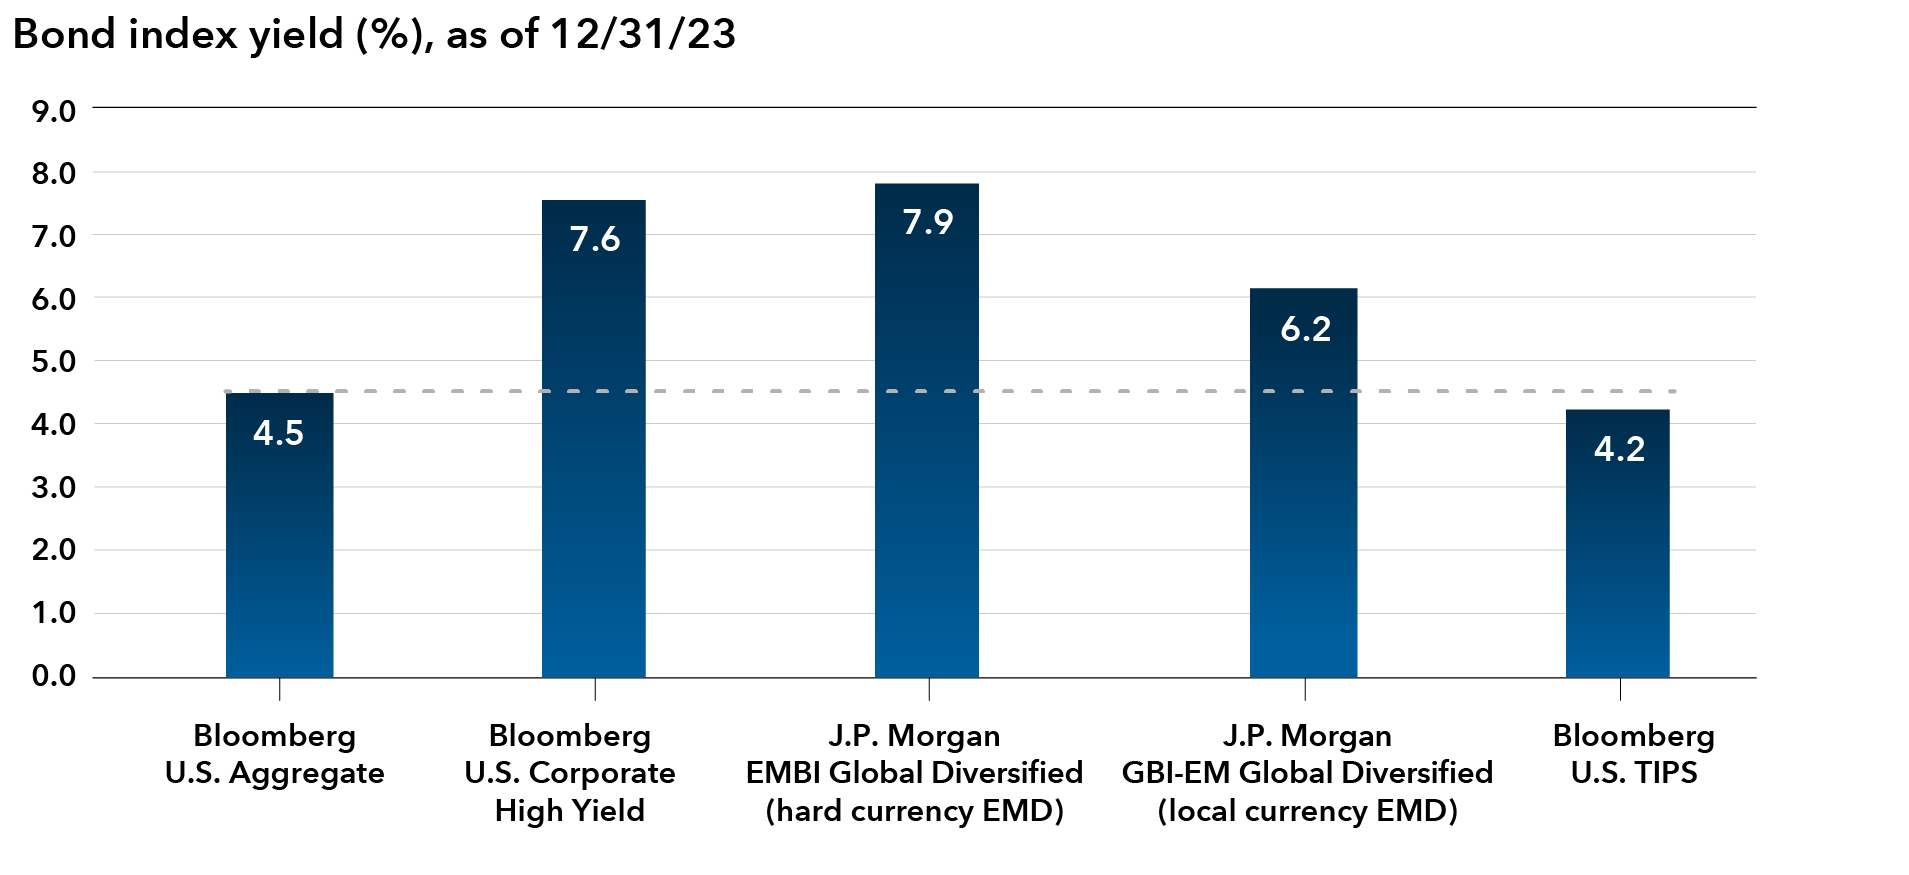
Source: RIMES. The Bloomberg indexes are yield-to-worst. The J.P. Morgan indexes are yield to maturity.
The case for active
From an investment perspective, a case could be made for active management in the fixed income space. With inflation expected to fall and the U.S. Federal Reserve evaluating rate cuts, the bond landscape is looking much clearer. Within many DC menus, core fixed income options often are active-only, unlike large-cap equity, where passive strategies are more prevalent, Capital Group’s 2023 Institutional Retirement Survey of Plan Sponsors revealed.
While core fixed income options can provide effective fixed income exposure, plan sponsors may be asking themselves if there are even more effective ways of achieving fixed income objectives for DC participants by expanding the opportunity set for bond funds in the plan. For active fixed income managers, the current environment presents a host of opportunities from duration and yield curve positioning, and security selection within corporate and securitized bonds. In addition, active managers are able to expand opportunities not only in security selection but within sectors that have attractive outlooks such as emerging market bonds. Plan sponsors offering only a passive fixed income option in the lineup should consider not only the diversification of the index but also the ability of skilled investment managers to add value over the index. Active managers can provide a higher level of diversification relative to the Agg, including consideration of spread sectors.
For some of the larger, well-resourced plans, plan sponsors could create a custom white-label option. White label solutions, which are constructed by putting together a diversified portfolio of strategies, may provide a better fixed income option to achieve multiple participant objectives. A white label option might combine Agg index exposure with allocations to “plus sectors” that are not in the Agg index, such as high-yield corporate debt, emerging markets debt (EMD) and U.S. Treasury Inflation-Protected Securities (TIPS).
When designing a white-label fixed income option, plan sponsors could draw inspiration from their plans’ asset allocation solution. Target date investments, for example, can alter the fixed income portfolio as participants approach retirement with more of a focus on income and capital preservation. A focus on these objectives within a diversified fixed income portfolio may be beneficial to older participants who are close to retirement with higher allocations to fixed income while not disadvantaging younger participants, who tend to have lower exposure to fixed income overall.
Based on Capital Group’s Capital Markets Assumptions (CMAs) and an efficient frontier made up of stocks and bonds, one can see the potential benefits of including high yield, EMD, and TIPS for individuals with higher fixed income allocations. The CMAs, developed by Capital Group’s analysts, make assumptions for returns and volatility (standard deviation) for the next 20 years. (Note that the estimates are not guarantees of future results and do not include the impact of any fees or active management of the investments. Also keep in mind that higher returning asset classes generally also come with greater risk, which diversification may be unable to eliminate).
The potential impact of plus sectors for older investors
For participants in and near retirement, who have relatively light equity allocations, adding fixed income sectors beyond the core can be especially impactful. Not only could it increase the yield (income) of the portfolio, it could potentially create a higher expected return portfolio per unit of risk. This is shown in the below chart, which compares return and volatility assumptions (standard deviation) of equity-core portfolios with an all-fixed-income portfolio consisting of a core sleeve and a plus sleeve of EMD, TIPS and high-yield debt. Although this all-bond portfolio generated greater hypothetical returns with similar volatility based on our CMAs, we are not suggesting that participants should adopt that exact portfolio. The appropriate balance between equity, core bonds and plus sectors within any portfolio will differ based on the plan demographics or a participant’s needs and objectives. However, we believe this analysis demonstrates the potential benefit of adding an appropriately sized plus sleeve to a participant’s core fixed income portfolio, especially for investors in retirement.
A “plus sleeve” could add significant value to a retiree’s bond-heavy portfolio
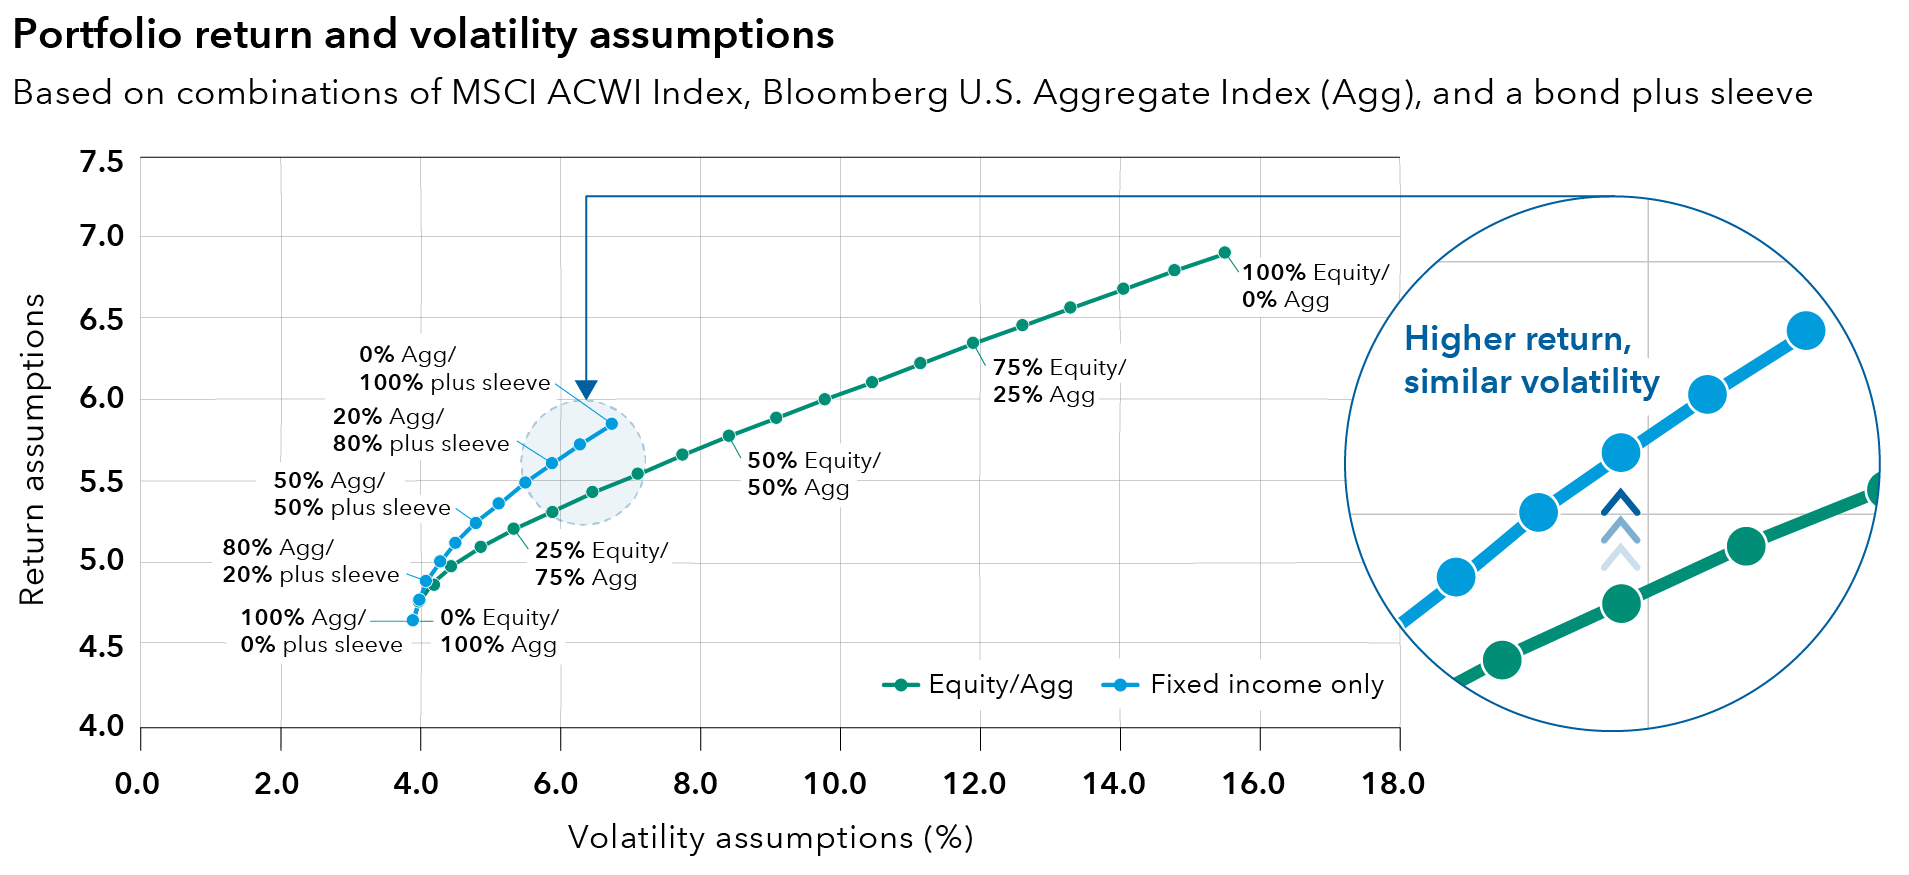
For illustrative purposes only. Source: Capital Group, based on capital market assumptions for the MSCI All Country World (ACWI) Index (global equity), the Bloomberg U.S. Aggregate Index (Agg) and a plus sleeve consisting of the following three equally weighted components: 1) 50% J.P. Morgan Emerging Markets Bond Index Global Diversified Index/50% J.P. Morgan GBI-EM Global Diversified, 2) Bloomberg U.S. High Yield Index and 3) Bloomberg U.S. TIPS Index. The assumptions for returns and volatility (standard deviation) were calculated based on Capital Group’s 20-year annualized Capital Markets Assumptions as of 12/31/23. Neither past results nor capital markets assumptions are predictive of actual future performance, and returns do not include any fees or any gains or losses from active management of the portfolio. All market forecasts are subject to a wide margin of error. Annualized standard deviation (based on monthly returns) is a common measure of absolute volatility that tells how returns over time have varied from the mean. A lower number signifies lower volatility. From left to right, each green dot adds 5 percentage points of equity exposure and subtracts 5 percentage points of Agg exposure. From left to right, each blue dot adds 10 percentage points of plus sleeve exposure and subtracts 10% of Agg exposure. The blue dots are connected by a blue line to form what is typically referred to as an “efficient frontier.”
The potential impact on investors near retirement
For investors near retirement, an allocation to equity, core bonds and the plus sleeve may provide some potential advantages over an equity-core portfolio, although less than for older investors. As the chart below shows, the equity/core/plus portfolio could offer higher returns with similar volatility than an equity-core portfolio.
A plus sleeve could be modestly additive in a more balanced portfolio held near retirement
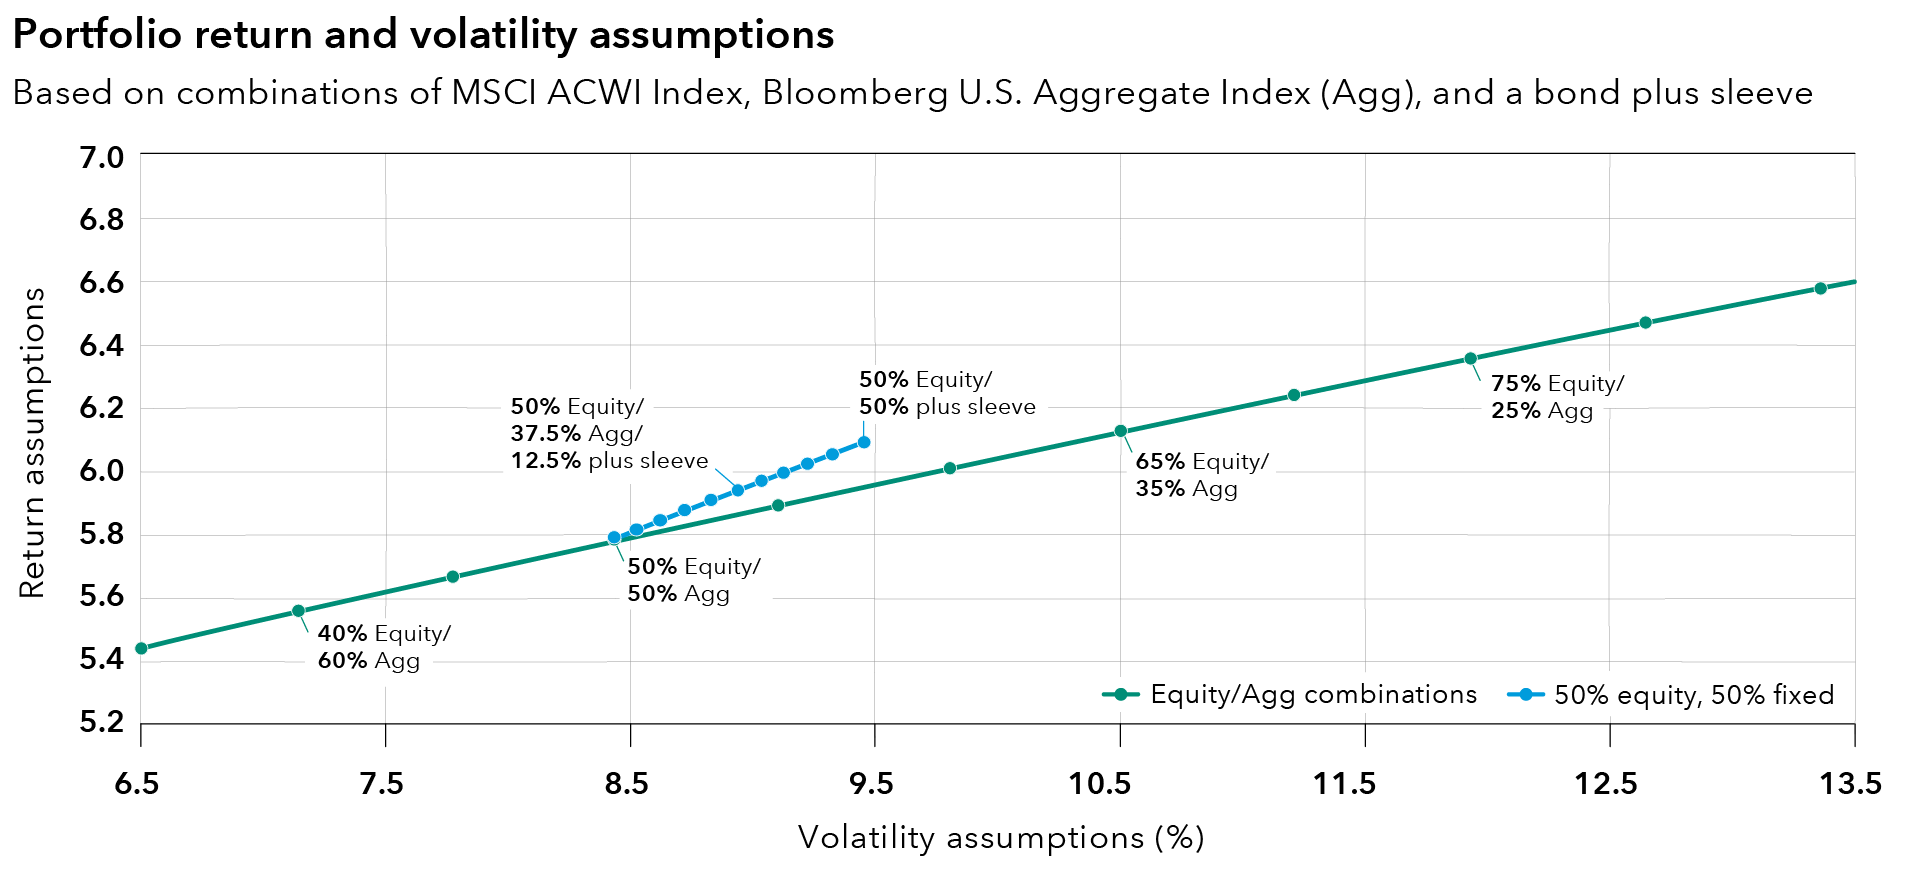
For illustrative purposes only. Source: Capital Group, based on capital market assumptions for the MSCI All Country World (ACWI) Index (global equity), the Bloomberg U.S. Aggregate Index (Agg) and a plus sleeve consisting of the following three equally weighted components: 1) 50% J.P. Morgan Emerging Markets Bond Index Global Diversified Index/50% J.P. Morgan GBI-EM Global Diversified, 2) Bloomberg U.S. High Yield Index and 3) Bloomberg U.S. TIPS Index. The assumptions for returns and volatility (standard deviation) were calculated based on Capital Group’s 20-year annualized Capital Markets Assumptions as of 12/31/23. Neither past results nor capital markets assumptions are predictive of actual future performance, and returns do not include any fees or any gains or losses from active management of the portfolio. All market forecasts are subject to a wide margin of error. From left to right, each green dot adds 5 percentage points of equity exposure and subtracts 5 percentage point of Agg exposure. From left to right, each blue dot adds 2.5 percentage points of the plus sleeve exposure and subtracts 2.5 percentage points of the Agg exposure — keeping the equity exposure constant at 50% of total assets.
The potential impact on younger investors
For investors far from retirement, adding a plus sleeve to an equity/core portfolio may have little impact on either expected risk or return, simply because younger investors tend to have much smaller fixed income exposure.
A plus sleeve could have little impact on an equity-heavy portfolio
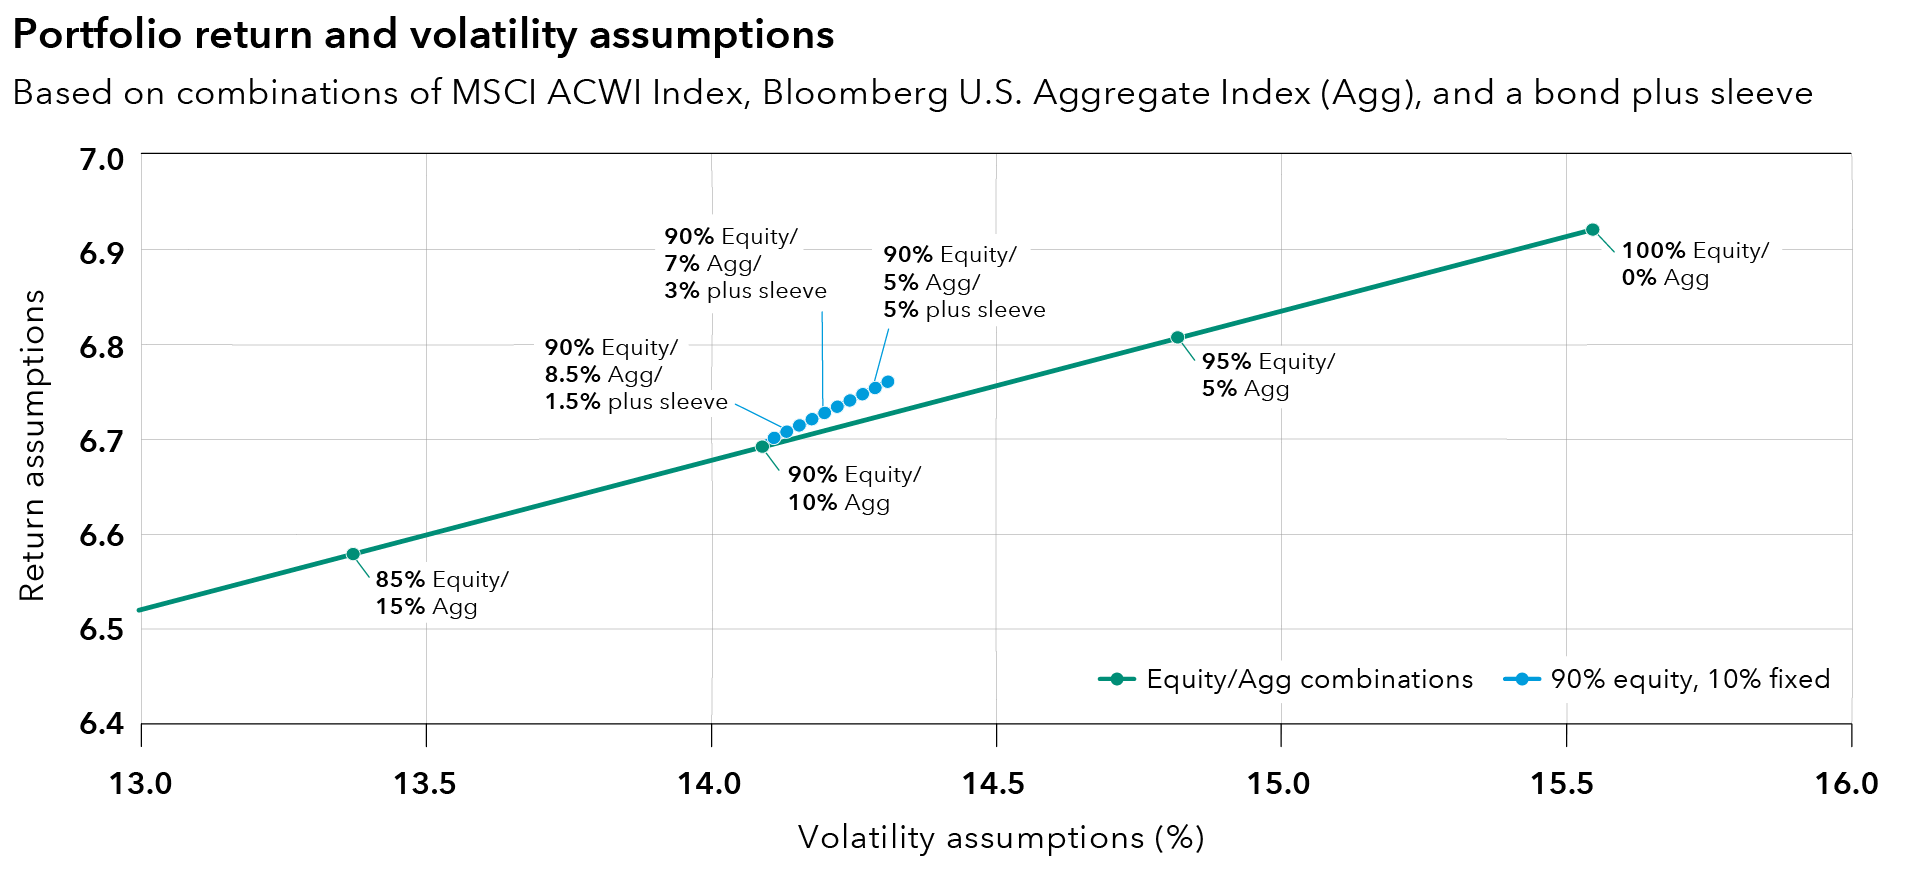
For illustrative purposes only. Source: Capital Group, based on capital market assumptions for the MSCI All Country World (ACWI) Index (global equity), the Bloomberg U.S. Aggregate Index (Agg) and a plus sleeve consisting of the following three equally weighted components: 1) 50% J.P. Morgan Emerging Markets Bond Index Global Diversified Index/50% J.P. Morgan GBI-EM Global Diversified, 2) Bloomberg U.S. High Yield Index and 3) Bloomberg U.S. TIPS Index. The assumptions for returns and volatility (standard deviation) were calculated based on Capital Group’s 20-year annualized Capital Markets Assumptions as of 12/31/23. Neither past results nor capital markets assumptions are predictive of actual future performance, and returns do not include any fees or any gains or losses from active management of the portfolio. All market forecasts are subject to a wide margin of error. From left to right, each green dot adds 5% of equity exposure and subtracts 5% of Agg exposure. From left to right, each blue dot adds 0.5 percentage points of plus sleeve exposure and subtracts 0.5 percentage points of Agg exposure — keeping the equity allocation constant at 90% of total assets.
Key considerations for plan sponsors
The good news is that the fixed income decline in 2022 did not cause participants to make significant asset allocation changes. ICI reports that only 8% of DC participants changed their asset allocation following 2022 compared to 11.8% in 2009 after the great financial crisis. 2023 brought stronger returns for bond markets in general, but now may be an ideal time to evaluate fixed income options for both diversification and the potential benefits of active management to help participants build DC portfolios.
Suggested next steps
- Evaluate white label fixed income options that can provide a more diversified and holistic approach for a participant’s fixed income allocation. This could:
- Improve diversification across fixed income markets for participants.
- Potentially help individuals in and near retirement by increasing portfolio yield and expected return per unit of risk without disadvantaging those with longer horizons/higher equity exposure.
- Consider actively managed fixed income portfolios to expand the opportunity set and potentially add value through security selection, credit and duration management as market conditions evolve. This can:
- Create greater alignment with investor objectives (such as equity diversification and/or income) than an index-tracking investment vehicle designed to represent a universe of securities.
- Result in greater sector diversification and risk management than an index-tracking investment vehicle that may become more concentrated in government securities.
Don't miss our latest insights.
Our latest insights
-
Defined Benefit
-
Liability-Driven Investing
-
Defined Benefit
-
Regulation & Legislation
-
Defined Contribution
About capital markets assumptions: This analysis represents the views of a small group of investment professionals based on their individual research and are approved by the Capital Market Assumptions Oversight Committee. They should not be interpreted as the view of Capital Group as a whole. As Capital Group employs The Capital SystemTM, the views of other individual analysts and portfolio managers may differ from those presented here. They are provided for informational purposes only and are not intended to provide any assurance or promise of actual returns. They reflect long-term projections of asset class returns and are based on the respective benchmark indices, or other proxies, and therefore do not include any fees or any outperformance gain or loss that may result from active portfolio management. Note that the actual results will be affected by any adjustments to the mix of asset classes. All market estimates are subject to a wide margin of error.
Passive (index-tracking) funds are not striving to outpace their benchmarks; rather, they seek to replicate the benchmark’s return pattern.
Diversification does not guarantee investment returns or eliminate the risk of loss, including in a declining market.
Capital Group's Institutional Retirement Survey of Plan Sponsors, conducted by the firm Escalent, surveyed 49 sponsors with DC plans in 2022.
Bond ratings, which typically range from AAA/Aaa (highest) to D (lowest), are assigned by credit rating agencies such as Standard & Poor's, Moody's and/or Fitch, as an indication of an issuer's creditworthiness.
In finance, an efficient frontier refers to the set of possible portfolios that are assumed to provide the highest returns for a given level of risk.
Spread sectors refer to nongovernmental fixed income securities with higher yields (spreads) and greater risk than comparable government securities. The term often encompasses high-yield and emerging markets debt.
Yield to maturity is the interest rate received by an investor who buys a bond at the market price and holds it until maturity. Yield to worst is the lowest yield that can be realized by either calling or putting on one of the available call/put dates or holding a bond to maturity.
There may have been periods when the results lagged the index(es) and/or average(s). The indexes are unmanaged and, therefore, have no expenses. Investors cannot invest directly in an index.
The J.P. Morgan Emerging Market Bond Index (EMBI) Global Diversified is a uniquely weighted emerging market debt benchmark that tracks total returns for U.S. dollar-denominated bonds issued by emerging market sovereign and quasi-sovereign entities. JP Morgan Government Bond Index – Emerging Markets Global Diversified covers the universe of regularly traded, liquid fixed-rate, domestic currency emerging market government bonds to which international investors can gain exposure. This index is unmanaged, and its results include reinvested dividends and/or distributions but do not reflect the effect of account fees, expenses or U.S. federal income taxes. These indexes are unmanaged, and their results include reinvested dividends and/or distributions but do not reflect the effect of account fees, expenses or U.S. federal income taxes.
50%/50% JP Morgan EMBI Global/JP Morgan GBI-EM Global Diversified blends the JP Morgan EMBI Global Index with the JP Morgan GBI-EM Global Diversified Index by weighting their cumulative total returns at 50% each. This assumes the blend is rebalanced monthly.
The Bloomberg U.S. Aggregate Index represents the U.S. investment-grade fixed-rate bond market. This index is unmanaged, and its results include reinvested dividends and/or distributions but do not reflect the effect of sales charges, commissions, account fees, expenses or U.S. federal income taxes.
The Bloomberg US Corporate High Yield Bond Index measures the U.S. dollar-denominated, high-yield, fixed-rate corporate bond market. Securities are classified as high yield if the middle rating of Moody's, Fitch and S&P is Ba1/BB+/BB+ or below. This index is unmanaged, and its results include reinvested dividends and/or distributions but do not reflect the effect of sales charges, commissions, account fees, expenses or U.S. federal income taxes.
The Bloomberg U.S. Treasury Inflation Protected Securities (TIPS) Index consists of investment-grade, fixed-rate, publicly placed, dollar-denominated and non-convertible inflation-protected securities issued by the U.S. Treasury that have at least one year remaining to maturity, and have at least $250 million par amount outstanding. This index is unmanaged, and its results include reinvested distributions but do not reflect the effect of sales charges, commissions, account fees, expenses or U.S. federal income taxes.
The MSCI All Country World Index is a free float-adjusted market capitalization weighted index that is designed to measure equity market results in the global developed and emerging markets, consisting of more than 40 developed and emerging market country indexes. Results reflect dividends gross of withholding taxes through December 31, 2000, and dividends net of withholding taxes thereafter. This index is unmanaged, and its results include reinvested dividends and/or distributions but do not reflect the effect of sales charges, commissions, account fees, expenses or U.S. federal income taxes.