
RESOURCES / INVESTMENT MENUS
Enhance manager selection in three steps
5-minute read
THE TAKEAWAY
Three screens that can help when searching for an active fund manager
Overview
While defined contribution (DC) plans have gravitated toward passive investments in recent years, many plan sponsors have chosen to still have active funds in their investment menus. Active investments carry the potential for higher returns than passive investments that seek to replicate a benchmark's return pattern since they are not striving to outpace their benchmarks, but active investments do require a bit more legwork when it comes to manager selection.
The selection process does not have to be a daunting task, however. Our research has found three screening factors that plan sponsors can use to enhance the selection process. Historically, these three screens have been associated with strong results for active equity managers.
In our research, we used Morningstar data to look at the universe of actively managed U.S. large-cap domestic funds from 1996 to 2020. After screening based on three factors, we reduced the field to just 39 from 2,632 funds. The resulting group of managers collectively delivered an average annual return of 9.65%, or 1.19% higher than all actively managed funds on an asset-weighted basis. (The specific methodology can be found at the end of this article.)
Selection criteria
Low expenses
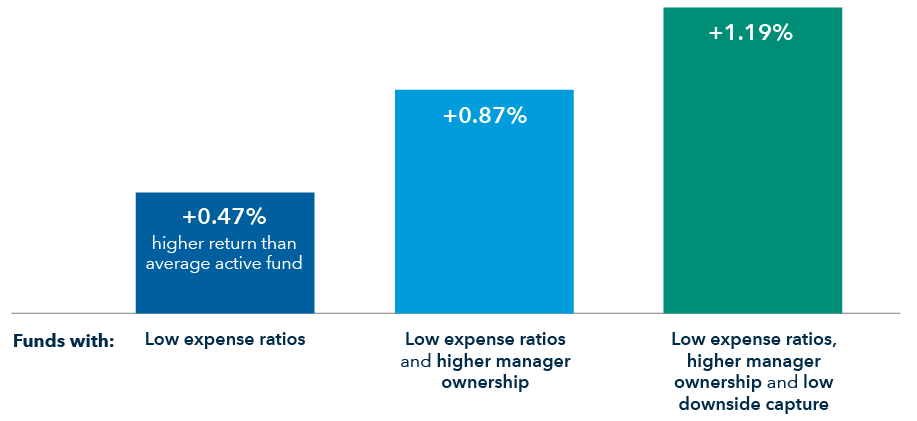
Cost is an important consideration for plan sponsors. The Employee Retirement Income Security Act of 1974 (ERISA) requires that only reasonable expenses should be paid within the confines of a defined contribution plan. In addition, higher expenses make it more difficult for an active fund to outpace its benchmark. We narrowed the list of actively managed funds in the universe to those that have funds within the lowest quartile of expense ratios versus peers. This smaller group of managers collectively had funds with an asset-weighted average annual return that was 0.47% higher than the unscreened cohort from all other actively managed funds.
High manager ownership
The high manager ownership screen examines to what extent portfolio managers invest their own money in the funds they manage. Personal ownership by fund managers was associated with better results in our study. We believe having “skin in the game” is a great motivator for portfolio managers and better aligns their interests with those of shareholders, as they both share in the fund’s potential risk and reward. Manager ownership is also a sign of high conviction in the strategy by the investment professionals.
We selected a group of actively managed funds that met the criteria of both low fees and high manager ownership. (These funds were both in the top quartile of lowest expense ratio and the top quartile of highest firm manager ownership, as measured at the fund family.) The result was an even smaller group of managers that had funds with an asset-weighted average annual return that was 0.87% higher than the unscreened cohort of actively managed funds.
Low downside capture
Downside capture measures a fund’s results relative to its benchmark during periods of market weakness. The lower the ratio, the better the fund held up during market declines. This has relevance because minimizing the fund’s losses during a negative period can help fuel better returns in the long run.
We selected a group of managers with funds that not only met the low fees and high manager ownership criteria, but also our hurdle for downside resilience: We looked for funds that spent most rolling monthly three-year periods in the best two quartiles of downside capture relative to the S&P 500 compared to their peers. These funds, which met all three screening criteria, outperformed the overall group of actively managed funds in the U.S. large-cap domestic space by 1.19%, returning an annual asset-weighted return of 9.65%.
Screened groups of equity funds vs. the entire universe of active U.S. large-cap funds (1996-2020)
Source: Capital Group based on Morningstar data
Questions
Below is some more information that could help with your manager search.
Explore more investment menus resources
-
Investment Menu
How to evaluate target date funds
-
Research methodology:
This article’s findings are Capital Group calculations based on monthly Morningstar data (1996-2020). Large-cap domestic funds are actively managed open-ended and exchange-traded funds in the Morningstar Large Value, Large Blend and Large Growth categories. Past results are not predictive of results in future periods. There have been periods when active funds meeting the criteria have lagged indexes. The U.S. large-cap universe was chosen because it is the largest Morningstar equity fund category by assets.
Please see additional information below for more details on the asset-weighted methodology as well as how we tracked low expenses, high manager ownership at the firm level, and low downside capture as well as the cohort that passed all three screens:
Asset-weighted average: Wherever possible, research findings are based on asset weighting rather than equal weighting. Exceptions are noted and explained where applicable. Asset-weighted comparisons used in this piece use the following process: for each equity-focused fund, we gathered the respective net returns and asset sizes for all the share classes available for each period. At this level, the returns are then share class-weighted, which means the returns are asset-weighted according to the share of assets associated with each share class within each fund. Each fund is then delineated by whether it is active or passive, then grouped into its respective Morningstar category. Additionally, the survivorship rate is accounted for (i.e., once created, we accounted for whether the funds have merged or closed during the measured period. In those cases where a fund is merged or closed, its asset-weighting is adjusted to zero and its assets are distributed to all other funds in the category. For newly created funds, the weight of that fund is zero until the period in which it has reported assets, whereupon we use the standard asset-weighting to weight the returns based on asset.). This methodology is used to more effectively portray the likely experience of market participants in the analyzed period versus an equal-weighting methodology, which is more appropriate when analyzing the performance of a specific fund over time, regardless of the size of its assets. Additionally, asset-weighting is often more appropriate when analyzing the results of an investment in an entire fund category. For example, the return of a $10 billion fund would count for 10 times as much as the return of a $1 billion fund. From there, as a fund’s assets grow or shrink relative to other funds, its effect on the category return would increase or decrease as appropriate.
Low expenses: In conducting our research, we searched Morningstar’s database for large-cap actively managed funds that were in the lowest quartile ranked by expense ratio. For this analysis, we relied on Morningstar Direct data analysis software. Least expensive quartile was calculated using annual report Net Expense Ratio (NER) for all observed Morningstar categories for the period indicated. For share classes with missing expense ratios, gaps between two available data points were filled in using linear interpolation. Linear interpolation is used with expense ratios in our analysis to provide a larger and more complete dataset when some are missing from the dataset. Most of the missing expense ratios are for the first year a fund incepted or the final year a fund was in existence (merged or liquidated). Interpolation is not used in these cases because there is not a data point before an inception year or after a final year of a fund. Interpolation is only used in the cases of an expense ratio missing in the middle of sequential expense ratios, as it is a straight line solution for an exact middle point between existing data points. For example, if the 2000 expense ratio is 35 basis points (bps), the 2001 expense ratio is missing, and the 2002 expense ratio is 37 bps, interpolation would estimate 2001 as 36 bps. Interpolation accounts for approximately 1% or less of the expense ratios across the different categories. Using the Large Cap Domestic category as an example, approximately 1% of possible expense ratios were estimated that meet this criteria, increasing the number of comparable expense ratios from 26,905 to 27,167 over the period from 1996 to 2021. The Securities and Exchange Commission (SEC) requires that mutual funds disclose all fees and expenses in a standardized table published in the front portion of the fund prospectus. Those funds in the Morningstar database that did not include an expense ratio were excluded from the analysis.
High manager ownership: Highest manager ownership quartile was calculated using weighted averages of Morningstar screens of manager holdings at the firm level. Each fund was assigned the weighted average of its firm manager holding. Funds without values were excluded from the quartile rankings. The SEC also requires that a fund disclose in its statements of additional information (SAI) certain information about its portfolio managers, including ownership of securities in the fund. Ownership disclosure is made using the following seven ranges: none; $1 to $10,000; $10,001 to $50,000; $50,001 to $100,000; $100,001 to $500,000; $500,001 to $1,000,000; and over $1,000,000. Those funds in the Morningstar database that did not include firm-level investment ownership information were excluded from the analysis.
Downside capture: Capture ratio reflects the annualized product of fund versus index returns for all months in which the index had a positive return (upside capture) or negative return (downside capture). Downside capture versus the appropriate market benchmark is calculated annually for every share class (alive and dead). A share class must have at least 36 months of returns to generate a capture result. Downside capture for each category is weighted by each fund’s average net assets by year.
Combination of the three factors: Active funds with low downside capture, low expense ratios and higher firm manager ownership is a group of active funds that are first filtered by identifying funds having a downside capture ratio (relative to the S&P 500 benchmark) that places them in the top 50% of their Morningstar peers over a majority of rolling three-year periods. We then filtered that group for the funds that are in the top quartile of both low expenses and fund firm high manager ownership.