Investment Fund

Vehicle: Mutual Fund Share Class
Purchase Restrictions: Class F-2 shares are available through certain registered investment advisor and fee-based programs, but are not available for purchase in most employer-sponsored retirement plans. See the prospectus for details.

Overview

Internal Prompt
A high-quality core bond portfolio with broad diversification. The fund has the ability to invest in every sector of the bond market and pursue multiple sources of active return, with a limited percentage of below-investment-grade holdings. This approach may help diversify equity risk in a portfolio.
Price at NAV $11.00 as of 4/15/2024 (updated daily)
Fund Assets (millions) $81,327.4
Portfolio Managers
5
Expense Ratio
(Gross/Net %)
0.35 / 0.35%

Internal Prompt

Returns at NAV

Returns at MOP

Asset Mix

U.S. Equities0.1%
Non-U.S. Equities0.0%
U.S. Bonds86.6%
Non-U.S. Bonds9.5%
Cash & Equivalents
3.8%
As of 3/31/2024 (updated monthly)
Internal Prompt

Volatility & Return

Read important investment disclosures

Fixed-Income

For Class F-2 Shares, this chart tracks the 10-year standard deviation
and 10-year annualized return of the fixed income funds
ABNFX
Bloomberg U.S. Aggregate Index
Other AF Funds
Standard Deviation as of 03/31/2024 (updated monthly) . Annualized return as of 03/31/2024 (updated monthly) .
VIEW LARGER CHART

Fund Statistics

5.9 years
Effective Duration
5%
Average Yield
to Worst
4.2%
Average Coupon
% of net assets as of 3/31/2024 (updated monthly)

Morningstar Style BoxTM— Fixed-Income

High Quality
Moderate Interest-Rate Sensitivity
Morningstar data as of 12/31/23 (updated quarterly)

Description

Objective
The fund's investment objective is to provide as high a level of current income as is consistent with the preservation of capital.
Distinguishing Characteristics
Taking a broadly diversified, high-quality approach, this core bond fund has the ability to invest in every sector of the bond market and pursue multiple sources of active return, with a limited percentage of below-investment-grade holdings. This approach may help diversify equity risk in a portfolio. The fund draws on our experience in managing U.S. core bonds since 1973 and a 90-year heritage of investing in U.S. markets.
Types of Investments
Primarily invests in corporate debt securities, U.S. and other government securities, mortgage-related securities and cash.
Holdings Outside the U.S.
May invest in fixed-income securities of corporations and government entities outside the United States.
Portfolio Restrictions
The fund generally invests at least 80% of its assets in bonds, including corporate bonds, U.S. government securities and money market instruments. At least 60% of its assets will be invested in securities rated A3/A- or better at the time of purchase (or unrated but determined by the fund’s investment adviser to be of equivalent quality). It is the fund’s current practice not to invest more than 10% of its assets in debt securities rated Ba1 and BB+ or below.

Fund Facts

Fund Inception 5/28/1974
Fund Assets (millions)
As of 2/29/2024
$81,327.4
Companies/Issuers
Holdings are as of 3/31/2024 (updated monthly).
1234+
Shareholder Accounts
Shareholder accounts are as of 3/31/2024
1,092,707
Regular Dividends Paid
Monthly
Minimum Initial Investment $250
Capital Gains Paid
Jun, Dec
Portfolio Turnover (2023) 466%
Fiscal Year-End Dec
Prospectus Date 03/01/2024
CUSIP 097873 82 2
Fund Number 608

Returns

Internal Prompt

Month-End Returns as of 3/31/24

Quarter-End Returns as of 3/31/24

Growth of 10K

Read important investment disclosures
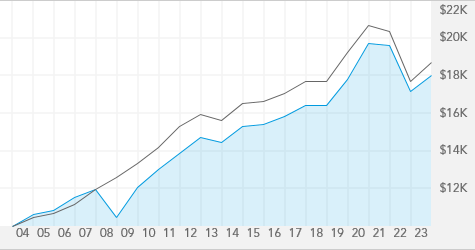
For Class F-2 Shares, this chart tracks a hypothetical investment with dividends reinvested, over the last 20 years, or since inception date if the fund has been in existence under 20 years, through 12/31/2023.
ABNFX
Bloomberg U.S. Aggregate Index

High & Low Prices

Internal Prompt

Yield

12-month
Distribution Rates
30-day SEC Yield
Fund at NAV 4.15% 4.81%
Fund at MOP N/A N/A
As of 3/31/2024 (updated monthly)
Years of Experience with Fund
Years of Experience with Capital Group
Years of Experience with Investment Industry
Pramod Atluri 8 8 20
David J. Betanzos 8 22 26
David A. Hoag 15 32 36
Fergus N. MacDonald 9 20 31
Chitrang Purani 1 2 20
A boldface number indicates that years of experience with Capital Group is equal to years of experience with investment industry.

Portfolio Composition

Morningstar Rating TM


Overall Morningstar RatingTM
Funds rated(426)
3-yr. Morningstar RatingTM
(426 funds rated)
5-yr. Morningstar RatingTM
(385 funds rated)
10-yr. Morningstar RatingTM
(275 funds rated)
Overall Morningstar Risk Average
HIGH
LOW
Category Intermediate Core Bond
Ratings are based on risk-adjusted returns as of 3/31/2024 (updated monthly).
Internal Prompt

Lipper Leader Scorecard

Over-all 3 yr. 5 yr. 10 yr.
Consistent Return Within Category
Funds Rated

(478)

(478)

(450)

(327)
Expense Within Category
Funds Rated

(309)

(309)

(285)

(190)
Preservation Within Category
Funds Rated

(6162)

(6162)

(5729)

(4171)
Tax Efficiency Within Category
Funds Rated

(479)

(479)

(453)

(330)
Total Return Within Category
Funds Rated

(481)

(481)

(453)

(330)
Category Core Bond Funds
KEY
HIGHEST LOWEST
As of 3/31/2024 (updated monthly)

Risk Measures

Fund
Standard Deviation
4.75
Sharpe Ratio
0.11
For the 10 Years ending 3/31/24 (updated monthly).
American Funds/
Morningstar Benchmark
Bloomberg US Agg Bond TR USD
R-squared 98
Beta 0.99
Capture Ratio (Downside/Upside) 95/101
American Funds and Morningstar Benchmark for the 10 Years ending 3/31/24 (updated monthly).
U.S. Treasuries/Agencies
20.6%
AAA/Aaa
42.4%
AA/Aa
3.4%
A
13.0%
BBB/Baa
13.6%
BB/Ba
2.2%
B
0.1%
CCC & Below
0.0%
Unrated
0.7%
Cash & equivalents
3.8%
% of net assets as of 3/31/2024 (updated monthly)

Average Life Breakdown

0-4.9 Years
40.1%
5-9.9 Years
45.4%
10-19.9 Years
4.9%
20-29.9 Years
5.5%
30+ Years
0.2%
% of net assets as of 3/31/2024 (updated monthly)

Holdings

Bonds Breakdown

Bond Details

Total bond holdings
U.S. Treasury bonds & notes 20.9%
Asset-backed obligations 5.4%
Non-U.S. government/agency securities 0.7%
General obligation bonds 0.3%
Revenue bonds 0.1%

% of net assets as of 3/31/2024 (updated quarterly)

Top Fixed-Income Issuers

U.S. Treasury
20.6%
Fannie Mae
12.5%
UMBS
10.9%
Federal Home Loan Mortgage
10.2%
Ginnie Mae II
2.1%

% of net assets as of 3/31/2024 (updated quarterly)

Geographic Breakdown

United States
86.7%
Europe
5.6%
Asia & Pacific Basin
1.5%
Other (Including Canada & Latin America)
2.5%
Cash & equivalents
3.8%
% of net assets as of 3/31/2024 (updated monthly)

Prices & Distributions

Internal Prompt

Historical Prices Month-End

Historical Prices Year-End

Internal Prompt

Historical Distributions as of 04/15/24

2024
Record
Date
Calculated
Date
Pay Date
Income Dividend Regular
Income Dividend Special
Cap. Gains Long-Term
Cap. Gains Short-Term
Reinvest NAV
Daily 01/31/24 02/01/24 $0.0414149 $0.00 $0.00 $0.00 $11.44
Daily 02/29/24 03/01/24 $0.0394145 $0.00 $0.00 $0.00 $11.22
Daily 03/28/24 04/01/24 $0.0415506 $0.00 $0.00 $0.00 $11.28
2024 Year-to-Date: Dividends Subtotal: $0.12237998 Cap Gains Subtotal: $0.00
Total Distributions: $0.12237998

Fees & Expenses

Internal Prompt

Fees

Annual Management Fees 0.20%
Other Expenses 0.15%
Service 12b-1 --
As of each fund's most recent prospectus.
Internal Prompt

Expense Ratio

ABNFX 0.35%
Lipper Core Bond Funds Average
0.47%
Fund as of most recent prospectus. Lipper Category as of 3/31/24 (updated quarterly).

Resources