Purchase Restrictions: Tax-exempt funds should generally not serve as investments for tax-deferred retirement plans and accounts. Class F-2 shares are available through certain registered investment advisor and fee-based programs, but are not available for purchase in most employer-sponsored retirement plans. See the prospectus for details.
Overview
Internal Prompt
A state specific approach to tax-exempt income.
Seeks to provide income exempt from state and federal taxes by focusing on higher quality investments that primarily provide funding for public services and projects in the state of California. It has the flexibility to invest in higher income securities across the ratings spectrum.
Price at NAV
$16.49
as of 4/19/2024 (updated daily)
Fund Assets (millions)
$2,921.7
Portfolio Managers
2
Expense Ratio
(Gross/Net %)
0.38 / 0.38%
(Gross/Net %)
Prospectus (PDF)
Asset Mix
| U.S. Equities0.0% | |
| Non-U.S. Equities0.0% | |
| U.S. Bonds88.1% | |
| Non-U.S. Bonds0.0% | |
| Cash & Equivalents |
As of 3/31/2024
(updated monthly)
Returns
Internal Prompt
Growth of 10K
Read important investment disclosures
TEFEX
Bloomberg California Municipal Index
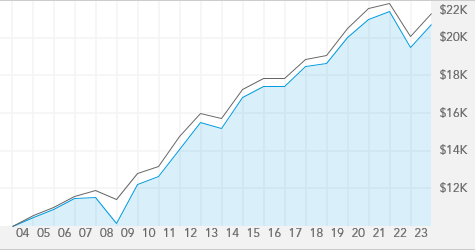
For Class F-2 Shares, this chart tracks a hypothetical investment with dividends reinvested, over the last 20 years, or since inception date if the fund has been in existence under 20 years, through 12/31/2023.
High & Low Prices
Portfolio Composition
Morningstar Rating TM
|
Overall Morningstar RatingTM
Funds rated(102)
|


|
|
3-yr. Morningstar RatingTM
(102 funds rated)
|
|
|
5-yr. Morningstar RatingTM
(96 funds rated)
|
|
|
10-yr. Morningstar RatingTM
(78 funds rated)
|
|
| Overall Morningstar Risk |
Below Average
HIGH
LOW
|
| Category | Muni California Long |
Ratings are based on risk-adjusted returns as of 3/31/2024 (updated monthly).
Internal Prompt
Lipper Leader Scorecard
| Overall Over-all | 3 yr. | 5 yr. | 10 yr. | |
|
Consistent Return Within Category Funds Rated |

|
|
|
|
|
Expense Within Category Funds Rated |

|
|
|
|
|
Preservation Within Category Funds Rated |

|
|
|
|
|
Tax Efficiency Within Category Funds Rated |

|
|
|
|
|
Total Return Within Category Funds Rated |
|
|
|
|
Category | CA Muni Debt Funds |
 KEY
KEY
HIGHEST
 LOWEST
LOWEST
As of 3/31/2024
(updated monthly)
%
of net assets as of 3/31/2024
(updated monthly)
Holdings
Bonds Breakdown
Bond Details
Total bond holdings
| Revenue bonds 82.8% | |
| General obligation bonds 5.2% | |
| Mortgage-backed obligations 0.1% |
% of net assets as of 3/31/2024 (updated quarterly)
Top Fixed-Income Issuers
% of net assets as of 3/31/2024 (updated quarterly)