Bonds
 Tim Ng
 Tom Reithinger
After one of the worst bond years on record in 2022, Canadian fixed income investors expected a return to normal this year. This expectation has largely been met, as bonds are delivering on their promise of stability, income, diversification and results — albeit modest ones — as of the midway mark of 2023. But bond uncertainty remains as central bankers continue to raise interest rates — rather than cut — to cool economies that many expected to be in recession now.
Is a recession still in the cards? Will inflation return to target? And is the bond renaissance still on? Tim Ng and Tom Reithinger, portfolio managers for Capital Group Canadian Core Plus Fixed Income Fund™ (Canada), answer these questions below.
1. Is the bond renaissance still on?
“Yes,” says Ng. “With starting yields where they are today, bonds offer more value than they have in a decade.”
Investors may have been surprised by a retreat in bond results in the second quarter, as the Bank of Canada (BoC) raised interest rates twice, but that has simply delayed — not derailed — the renaissance, according to Ng. In fact, yields inside and outside Canada have continued to march higher as the year has progressed and now stand markedly above the lows seen before rates started to rise in March 2022.
Higher yields
.png)
Sources: Bloomberg, Bloomberg Index Services Ltd., JPMorgan. As of 7/31/23. Sector yields above include Bloomberg U.S. Aggregate Bond Index, Bloomberg U.S. Corporate Investment Grade Index, Bloomberg U.S. Corporate High Yield Index and 50% J.P. Morgan EMBI Global Diversified Index/50% J.P. Morgan GBI-EM Global Diversified Index. Period of time considered is from 2020 to present. Dates for recent lows from top to bottom in chart shown are: 8/4/20, 12/31/20, 7/6/21, 1/4/21 and 7/27/21. Yields shown are yield to worst. Yield to worst is the lowest yield that can be realized by either calling or putting on one of the available call/put dates or holding a bond to maturity. "Change" figures may not reconcile due to rounding.
“The fact that central bankers in Canada, the U.S. and Europe are reducing the pace and size of interest rate increases, with some near the end of their rate-hiking cycles, is bond-positive,” says Reithinger.
Further, if bankers start cutting rates, prices should rise as bonds in an investor’s portfolio will be worth more, he says. And if the opposite happens — central bankers reverse course and start aggressively hiking again — investors can take comfort in knowing they’ve invested in much higher yields giving them ‘carry’ or coupon income, which is over 8% on a high-yield U.S. corporate bond as of July 31, 2023, according to Reithinger.
“If a recession comes to pass, investors may also benefit, as bonds will provide much needed stability and diversification from equities,” he says.
The bottom line? Ng says it’s more important to be early in bond markets rather than late, so investors can lock in higher yields and benefit from price appreciation.
2. Is a Canadian recession still in the cards?
“There are definite signs the Canadian economy is slowing and likely to slow further, so yes, a recession is still in the cards,” says Ng, who points to May’s read on gross domestic product, which came in at a weak 0.3%. This suggests a 1% annualized rate of growth for the second quarter, which is below BoC estimates.
Other signposts of slowing growth, according to Ng, are contained in BoC surveys that poll Canadian businesses on their outlooks. The surveys are especially informative because they’re leading, not lagging, indicators. In the BoC’s second-quarter Business Outlook Survey (BOS), Canadian economic weakness is evident on a range of fronts. The BOS’s key outlook indicator, which aggregates expectations of business across Canada for the next three to six months, continues to trend down.
Negative again
.png)
Note: The BOS indicator is a summary measure of the main Business Outlook Survey (BOS) questions. Business activity indicators are those related to past sales declines, future sales growth, indicators of future sales, employment and investment. Price and cost indicators are those related to input and output price growth as well as credit conditions. Capacity indicators are those related to labour shortages, labour shortage intensity and the ability to meet demand.
Source: Business Outlook Survey, Second Quarter of 2023, Bank of Canada.
“Results for all categories of questions, regions and sectors are now contributing negatively to the survey’s key outlook indicator,” says Ng. In addition to more businesses having weaker hiring and investment outlooks, companies are also experiencing broader tightening in credit conditions.
Further, businesses linked directly and indirectly to consumer discretionary spending also think high interest rates have curbed sales of their products and services and they anticipate further weakening. Most notably, indicators of future sales, either through order books or sales inquiries, are well below historical average levels.
“These indicators are flashing yellow, if not red, but at the same time, they don't say a recession is a sure thing. They just confirm the risk of recession is high,” Ng says.
It’s worth noting that labour markets continue to demonstrate strength, although signs of weakness are also beginning to appear. The latest jobs report from Statistics Canada showed the Canadian economy shed 6,400 jobs in July, while the jobless rate ticked up to 5.5%. The economy has now lost jobs in two of the three previous months.
According to Reithinger, this may lead the BoC to pause at its next policy-setting meeting September 6, but it doesn’t mean the rate-tightening campaign is over.
“No central banker wants to be remembered as the one who let inflation get away, so we could see another rate increase whether it ultimately tips the economy into recession or not,” he says.
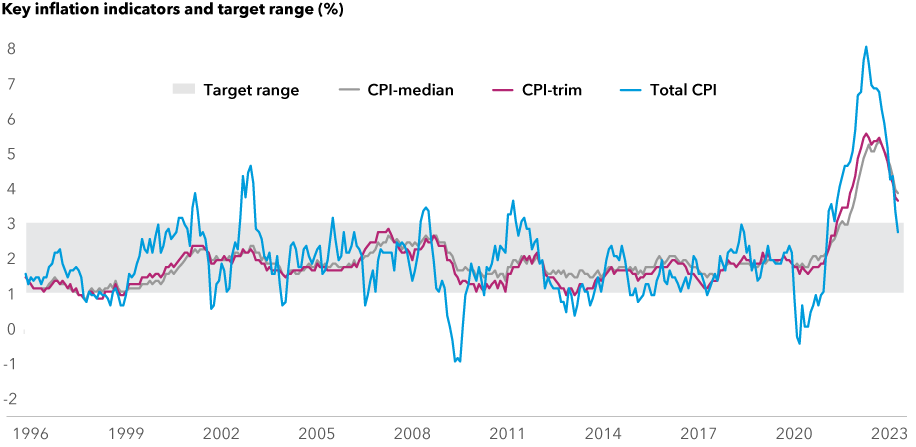
3. Will inflation return to target?
“Inflation is trending in the right direction with peak price pressures likely behind us,” says Ng.
His optimism stems from the “breadth” of inflation narrowing in the BoC’s preferred gauges used to measure price changes. Unlike the Total Consumer Price Index (CPI), which tracks the prices of a full basket of goods, the bank’s preferred gauges eliminate more volatile items such as gasoline to give the BoC a clearer picture of inflationary pressures. One of these gauges, CPI-trim, peaked at 5.6% in June 2022 and now stands at 3.7% in June 2023, while CPI—median, which reached a high of 5.4% in November 2022, has now fallen to 3.9% at June 2023.
Falling, but how far?
Source: Bank of Canada.
“We think this trend will continue with inflation further moderating,” he says. But there’s a caveat. According to him, there are reasons to believe the trough for inflation will be historically higher than it used to be in the days to come.
Due to the twin forces of deglobalization and enormous injections of money from central bankers during the pandemic and before (the Great Financial Crisis), Ng anticipates annual inflation may run higher than bankers are currently targeting.
“I can see annual inflation above 2% for some time,” he says.
This poses an interesting question for some central bankers who are bound by mandate to keep inflation in check. Although the BoC aims to keep inflation at 2%, it has some wiggle room above and below due to its stated inflation-control target range of 1% to 3%. In contrast, the U.S. Federal Reserve has no such “range” but rather a hard target of 2%.
Does that mean the Fed will continue to raise rates if inflation remains stuck somewhere above 2%, say 2.25% or 2.50%?
“That’s the million-dollar question,” says Ng, “and it’s something investors will be watching closely.”
Our latest insights
-
-
Interest Rates
-
Global Equities
-
Artificial Intelligence
-
Technology & Innovation
RELATED INSIGHTS
Commissions, trailing commissions, management fees and expenses all may be associated with mutual fund investments. Please read the prospectus before investing. Mutual funds are not guaranteed, their values change frequently and past performance may not be repeated.
Unless otherwise indicated, the investment professionals featured do not manage Capital Group‘s Canadian mutual funds.
References to particular companies or securities, if any, are included for informational or illustrative purposes only and should not be considered as an endorsement by Capital Group. Views expressed regarding a particular company, security, industry or market sector should not be considered an indication of trading intent of any investment funds or current holdings of any investment funds. These views should not be considered as investment advice nor should they be considered a recommendation to buy or sell.
Statements attributed to an individual represent the opinions of that individual as of the date published and do not necessarily reflect the opinions of Capital Group or its affiliates. This information is intended to highlight issues and not be comprehensive or to provide advice. For informational purposes only; not intended to provide tax, legal or financial advice. We assume no liability for any inaccurate, delayed or incomplete information, nor for any actions taken in reliance thereon. The information contained herein has been supplied without verification by us and may be subject to change. Capital Group funds are available in Canada through registered dealers. For more information, please consult your financial and tax advisors for your individual situation.
Forward-looking statements are not guarantees of future performance, and actual events and results could differ materially from those expressed or implied in any forward-looking statements made herein. We encourage you to consider these and other factors carefully before making any investment decisions and we urge you to avoid placing undue reliance on forward-looking statements.
The S&P 500 Composite Index (“Index”) is a product of S&P Dow Jones Indices LLC and/or its affiliates and has been licensed for use by Capital Group. Copyright © 2024 S&P Dow Jones Indices LLC, a division of S&P Global, and/or its affiliates. All rights reserved. Redistribution or reproduction in whole or in part are prohibited without written permission of S&P Dow Jones Indices LLC.
FTSE source: London Stock Exchange Group plc and its group undertakings (collectively, the "LSE Group"). © LSE Group 2024. FTSE Russell is a trading name of certain of the LSE Group companies. "FTSE®" is a trade mark of the relevant LSE Group companies and is used by any other LSE Group company under licence. All rights in the FTSE Russell indices or data vest in the relevant LSE Group company which owns the index or the data. Neither LSE Group nor its licensors accept any liability for any errors or omissions in the indices or data and no party may rely on any indices or data contained in this communication. No further distribution of data from the LSE Group is permitted without the relevant LSE Group company's express written consent. The LSE Group does not promote, sponsor or endorse the content of this communication. The index is unmanaged and cannot be invested in directly.
BLOOMBERG® is a trademark and service mark of Bloomberg Finance L.P. and its affiliates (collectively “Bloomberg”). Bloomberg or Bloomberg’s licensors own all proprietary rights in the Bloomberg Indices. Neither Bloomberg nor Bloomberg’s licensors approves or endorses this material, or guarantees the accuracy or completeness of any information herein, or makes any warranty, express or implied, as to the results to be obtained therefrom and, to the maximum extent allowed by law, neither shall have any liability or responsibility for injury or damages arising in connection therewith.
MSCI does not approve, review or produce reports published on this site, makes no express or implied warranties or representations and is not liable whatsoever for any data represented. You may not redistribute MSCI data or use it as a basis for other indices or investment products.
Capital believes the software and information from FactSet to be reliable. However, Capital cannot be responsible for inaccuracies, incomplete information or updating of the information furnished by FactSet. The information provided in this report is meant to give you an approximate account of the fund/manager's characteristics for the specified date. This information is not indicative of future Capital investment decisions and is not used as part of our investment decision-making process.
Indices are unmanaged and cannot be invested in directly. Returns represent past performance, are not a guarantee of future performance, and are not indicative of any specific investment.
All Capital Group trademarks are owned by The Capital Group Companies, Inc. or an affiliated company in Canada, the U.S. and other countries. All other company names mentioned are the property of their respective companies.
Capital Group funds are offered in Canada by Capital International Asset Management (Canada), Inc., part of Capital Group, a global investment management firm originating in Los Angeles, California in 1931. Capital Group manages equity assets through three investment groups. These groups make investment and proxy voting decisions independently. Fixed income investment professionals provide fixed income research and investment management across the Capital organization; however, for securities with equity characteristics, they act solely on behalf of one of the three equity investment groups.
The Capital Group funds offered on this website are available only to Canadian residents.