U.S. Equities
 David Polak
The Magnificent Seven stocks — Alphabet, Amazon, Apple, Meta, Microsoft, Nvidia and Tesla — now sport a market cap of around $12 trillion (in U.S. dollar terms). Looking further into the market, the sales and profitability of the next $12 trillion in market cap are represented by 42 companies from a broad set of industries ranging from tech and health care to financials and consumer companies.
Can the Magnificent Seven maintain their dominance?
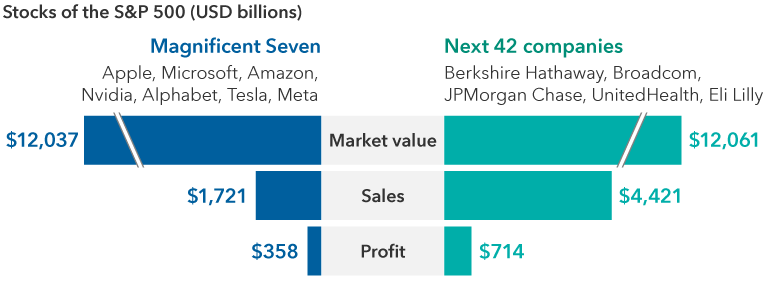
Sources: Capital Group, LSEG. Next 42 companies represent stocks following the Magnificent Seven, ranked by market capitalization, with the above stocks topping the list. Sales are the net sales (or revenues) of the relevant item reported in the last 12 months. Profit is represented by the trailing 12-month operating profit. As of December 31, 2023. Values are in USD.
Both the 12-month forward sales and earnings for this next set of companies making up a $12 trillion market cap are higher than for the Magnificent Seven, according to London Stock Exchange Group (LSEG) data as of December 31, 2023 — yet another data point indicating U.S. stock market performance could broaden in the coming years, pending earnings outlooks.
Our focus remains on valuations given the rise in share prices for the Magnificent Seven. The S&P 500 Index has a forward price-to-earnings (P/E) ratio of about 15.5x excluding the Magnificent Seven, while the Magnificent Seven has a P/E of about 35x, according to data compiled by FactSet as of January 2, 2024. Earnings growth estimates in 2024 bring the division into high relief — the Magnificent Seven boasts 20.8%, with the S&P 500 at 11.5%, and S&P 500 sans-Magnificent Seven at 6.7%, respectively. For 2025, earnings growth estimates for those three groups are projected at about 17%, 12% and 6.7%, respectively. Longer term earnings estimates for the M7 remain higher, but the uncertainty band around them would also be higher. Hence, the need to diversify.
There’s a strong case to be made for the companies apart from their stock performance. The Bloomberg Magnificent 7 Total Return Index advanced 107% in 2023 versus the overall S&P 500 Index at 24%, largely because the positive fundamentals more than offset headwinds from rising interest rates. In 2023, these companies implemented stronger cost discipline through headcount reductions and capital reallocation to more profitable projects.
Sound balance sheets and strong cash generation give the Magnificent Seven an edge to invest in research and development, while also investing in artificial intelligence (AI) to potentially drive growth in the coming years. Last year, these companies in aggregate spent over $170 billion in capital expenditures and over $200 billion on research and development on initiatives that might have a secular impact on the economy, such as AI applications.
Risks to the group include elevated investor expectations after strong earnings in a choppy economic environment. Additionally, signs of global economic weakness could impact certain big-cap tech stocks more than others. Heightened geopolitical tensions and regulatory questions may also linger throughout 2024.
Nevertheless, investors may want to consider some exposure to the Magnificent Seven and also a broader set of stocks within the S&P 500 — as well as non-U.S. markets, where in some cases valuations are reasonable and prospects for both top-line and bottom-line growth look promising.
The Bloomberg Magnificent 7 Total Return Index is an equal-dollar weighted equity benchmark consisting of a fixed basket of 7 widely-traded companies classified in the United States and representing the Communications, Consumer Discretionary and Technology sectors as defined by Bloomberg Industry Classification System (BICS).
The S&P 500 Index is a market-capitalization-weighted index based on the results of 500 widely held common stocks.
London Stock Exchange Group plc and its group undertakings (collectively, the “LSE Group”). © LSE Group 2024. FTSE Russell is a trading name of certain of the LSE Group companies. FTSE® and Russell® indices are trademarks of the relevant LSE Group companies and are used by any other LSE Group company under licence. All rights in the FTSE Russell indices or data vest in the relevant LSE Group company which owns the index or the data. Neither LSE Group nor its licensors accept any liability for any errors or omissions in the indices or data and no party may rely on any indices or data contained in this communication. No further distribution of data from the LSE Group is permitted without the relevant LSE Group company's express written consent. The LSE Group does not promote, sponsor or endorse the content of this communication.
Our Latest Insights
-
-
Interest Rates
-
Global Equities
-
Artificial Intelligence
-
Technology & Innovation
RELATED INSIGHTS
-
-
Interest Rates
-
Global Equities
Commissions, trailing commissions, management fees and expenses all may be associated with mutual fund investments. Please read the prospectus before investing. Mutual funds are not guaranteed, their values change frequently and past performance may not be repeated.
Unless otherwise indicated, the investment professionals featured do not manage Capital Group‘s Canadian mutual funds.
References to particular companies or securities, if any, are included for informational or illustrative purposes only and should not be considered as an endorsement by Capital Group. Views expressed regarding a particular company, security, industry or market sector should not be considered an indication of trading intent of any investment funds or current holdings of any investment funds. These views should not be considered as investment advice nor should they be considered a recommendation to buy or sell.
Statements attributed to an individual represent the opinions of that individual as of the date published and do not necessarily reflect the opinions of Capital Group or its affiliates. This information is intended to highlight issues and not be comprehensive or to provide advice. For informational purposes only; not intended to provide tax, legal or financial advice. We assume no liability for any inaccurate, delayed or incomplete information, nor for any actions taken in reliance thereon. The information contained herein has been supplied without verification by us and may be subject to change. Capital Group funds are available in Canada through registered dealers. For more information, please consult your financial and tax advisors for your individual situation.
Forward-looking statements are not guarantees of future performance, and actual events and results could differ materially from those expressed or implied in any forward-looking statements made herein. We encourage you to consider these and other factors carefully before making any investment decisions and we urge you to avoid placing undue reliance on forward-looking statements.
The S&P 500 Composite Index (“Index”) is a product of S&P Dow Jones Indices LLC and/or its affiliates and has been licensed for use by Capital Group. Copyright © 2024 S&P Dow Jones Indices LLC, a division of S&P Global, and/or its affiliates. All rights reserved. Redistribution or reproduction in whole or in part are prohibited without written permission of S&P Dow Jones Indices LLC.
FTSE source: London Stock Exchange Group plc and its group undertakings (collectively, the "LSE Group"). © LSE Group 2024. FTSE Russell is a trading name of certain of the LSE Group companies. "FTSE®" is a trade mark of the relevant LSE Group companies and is used by any other LSE Group company under licence. All rights in the FTSE Russell indices or data vest in the relevant LSE Group company which owns the index or the data. Neither LSE Group nor its licensors accept any liability for any errors or omissions in the indices or data and no party may rely on any indices or data contained in this communication. No further distribution of data from the LSE Group is permitted without the relevant LSE Group company's express written consent. The LSE Group does not promote, sponsor or endorse the content of this communication. The index is unmanaged and cannot be invested in directly.
BLOOMBERG® is a trademark and service mark of Bloomberg Finance L.P. and its affiliates (collectively “Bloomberg”). Bloomberg or Bloomberg’s licensors own all proprietary rights in the Bloomberg Indices. Neither Bloomberg nor Bloomberg’s licensors approves or endorses this material, or guarantees the accuracy or completeness of any information herein, or makes any warranty, express or implied, as to the results to be obtained therefrom and, to the maximum extent allowed by law, neither shall have any liability or responsibility for injury or damages arising in connection therewith.
MSCI does not approve, review or produce reports published on this site, makes no express or implied warranties or representations and is not liable whatsoever for any data represented. You may not redistribute MSCI data or use it as a basis for other indices or investment products.
Capital believes the software and information from FactSet to be reliable. However, Capital cannot be responsible for inaccuracies, incomplete information or updating of the information furnished by FactSet. The information provided in this report is meant to give you an approximate account of the fund/manager's characteristics for the specified date. This information is not indicative of future Capital investment decisions and is not used as part of our investment decision-making process.
Indices are unmanaged and cannot be invested in directly. Returns represent past performance, are not a guarantee of future performance, and are not indicative of any specific investment.
All Capital Group trademarks are owned by The Capital Group Companies, Inc. or an affiliated company in Canada, the U.S. and other countries. All other company names mentioned are the property of their respective companies.
Capital Group funds are offered in Canada by Capital International Asset Management (Canada), Inc., part of Capital Group, a global investment management firm originating in Los Angeles, California in 1931. Capital Group manages equity assets through three investment groups. These groups make investment and proxy voting decisions independently. Fixed income investment professionals provide fixed income research and investment management across the Capital organization; however, for securities with equity characteristics, they act solely on behalf of one of the three equity investment groups.
The Capital Group funds offered on this website are available only to Canadian residents.