Global Equities
Categories
Manufacturing
Can Europe’s largest economy adapt to a shifting global landscape?
 Robert Lind
April 9, 2024
In spite of intensifying concerns around deindustrialization, German manufacturing is quickly adapting to a new economic paradigm. In the short term, it will likely see continued pressure on energy-intensive sectors, but in the medium to longer term, there are encouraging signs that German industry can establish itself in low-carbon technologies.
As the world rapidly digitizes and the automotive industry embraces electric cars, Germany risks falling further behind countries such as China that have developed their technological capabilities. On a comparative basis, Germany’s labour costs exceed other manufacturing regions. Adding to its struggles is stagnant labour productivity as Germany’s aging population retires or shifts to part-time work. This trend doesn’t bode well given Germany’s historic strength producing leading-edge automobiles and dominating the manufacture of equipment, chemicals and pharmaceuticals.
Germany was the only Group of Seven (G7) member to post negative growth in 2023, and some fear a prolonged period of stagnation. Yet, green shoots still sprout as the economy attempts both near- and long-term structural shifts.
Does a sharp drop in manufacturing spell trouble for Germany?
Monthly industrial production figures from the Bundesbank revealed a sharp drop in manufacturing output to cap 2023. Consumer durables posted particularly weak output, falling 5% in the fourth quarter of 2023 and 11% year over year. Tighter financial conditions and the uncertainty around the health of China’s economy are impediments forcing industry to adapt.
German output mounts comeback after weak end to 2023
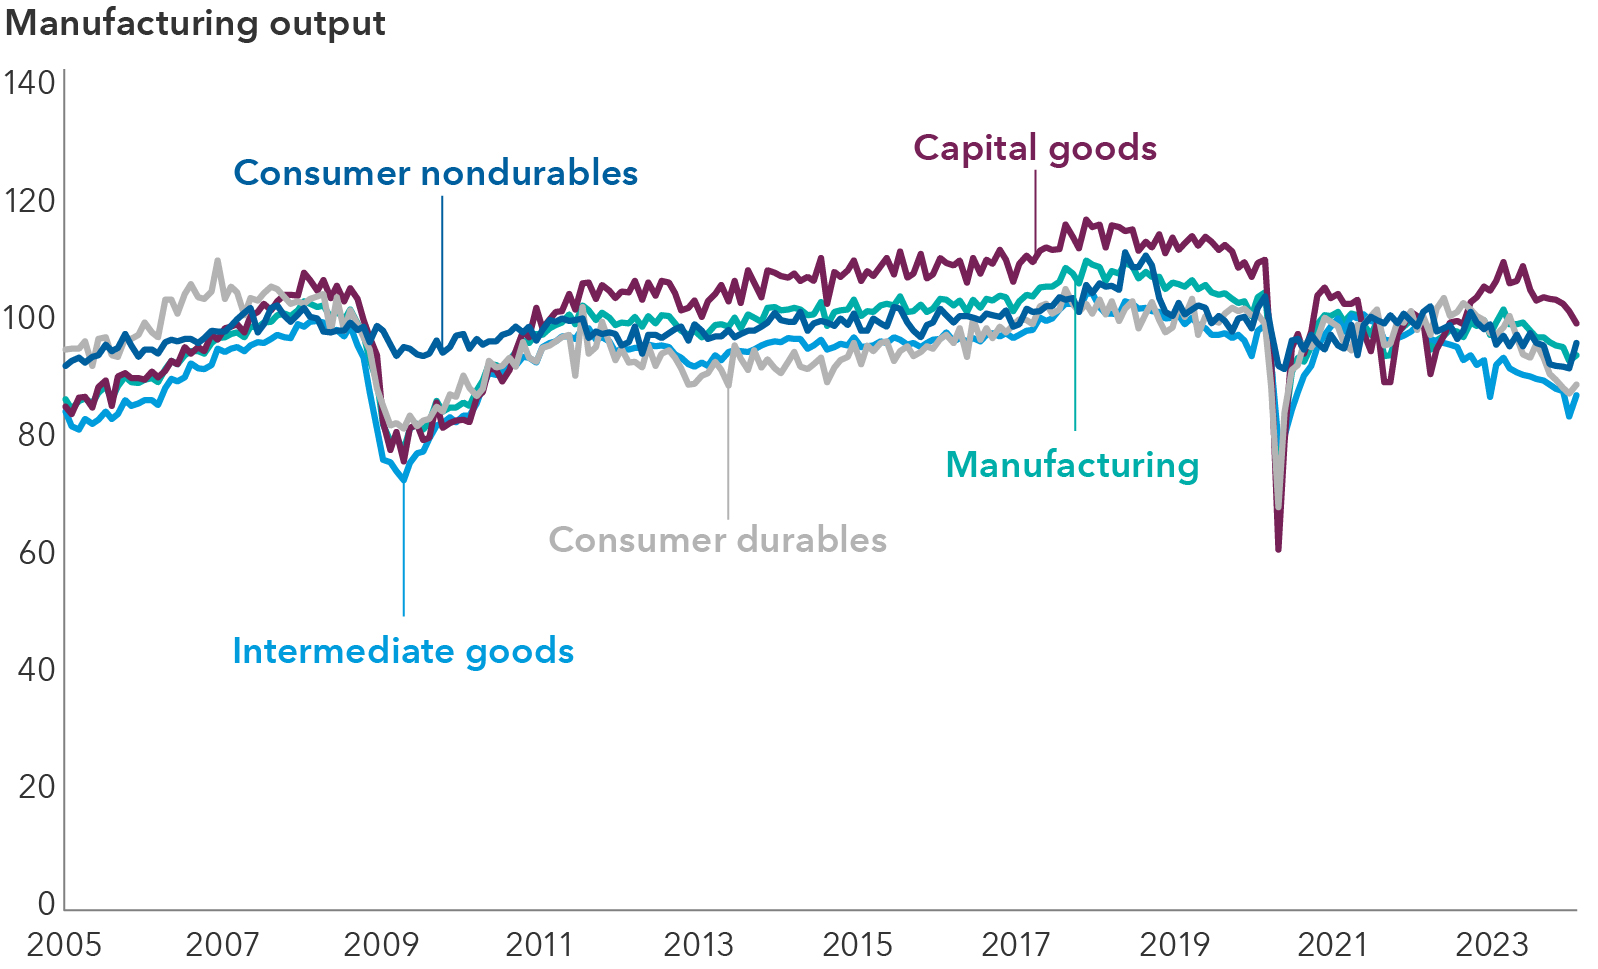
Source: Bundesbank. Based on an index of production (2021=100). Data as of March 31, 2024.
A look under the hood of the data shows the economy is moving to higher value-added manufacturing
Despite Germany’s woes, monthly data could be overstating the weakness in manufacturing activity. Quarterly estimates of gross value added (GVA) suggest manufacturing activity was more resilient in 2023, which may reflect a boost relative to production or may signal German firms have shifted to higher-value products within industries. GVA is the value for the amount of goods produced, excluding input and material costs.
German output more resilient than expected
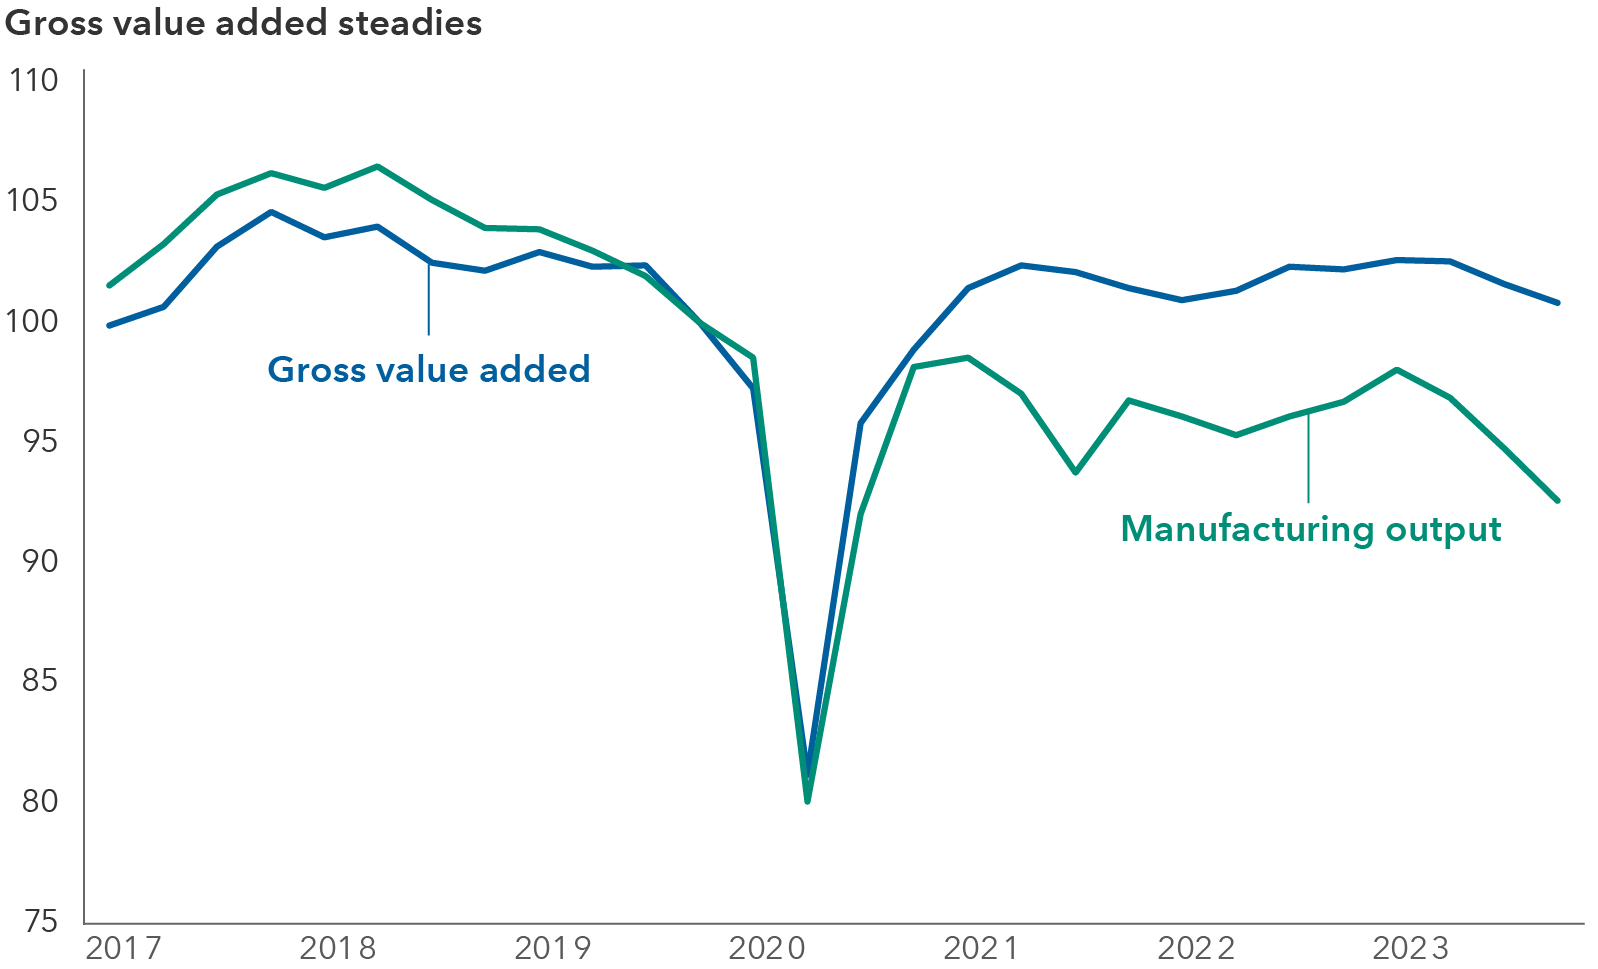
Sources: German Federal Statistical Office (Destatis), Bundesbank. Based on an index of production (2019 Q4=100). Data as of March 31, 2024.
On a cyclical basis, the industrial downturn may be close to an end
While the cyclical downturn has had a broad impact, manufacturing has been hurt less than other sectors, including construction and retail, according to the Munich-based Institute for Economic Research (Ifo). Taking a step back, Germany’s manufacturing sector isn’t nearly as weak as it was in 2008 or 2009, nor in 2020 during the COVID-19 pandemic. The Ifo’s most recent business climate survey revealed a rise in March, with less pessimism expressed by companies. Still, there are signs that inventories are now at more comfortable levels so that any increase in orders could feed through to higher output over the next six to nine months.
Exporters face vulnerability due to their reliance on China
Germany’s exports could soon face headwinds from lingering high interest rates along with an economic slowdown in China. German companies are curtailing reliance on China, but they still rely on Chinese imports for production, creating another barrier to a quick economic turnaround. China also boosted its own exports to other nations, creating global competition for German companies that sell goods abroad.
Germany’s trade-to-GDP ratio is over 80%, which is well above other major European economies (typically around 50% to 60%) and the United States and China (around 20% to 30%). This exemplifies Germany’s sensitivity and reliance on global trade. Meanwhile, German manufacturing GVA still accounts for 20% of the total German economy, compared to about 10% in the U.S., United Kingdom and France.
Automobiles, particularly electric vehicles (EVs), illustrate Germany’s fight to maintain its historic industrial reign. Chinese automakers, including BYD, compete technologically and at lower cost. In response, the EU Commission launched an anti-subsidy investigation against Chinese EV makers last year. The investigation continues and could result in some modest duties applied by the EU, which in turn could spark retaliation by China. While this could help its automakers catch up on EVs, Germany remains highly exposed to commerce with China and should avoid a caustic trade spat.
The economy and society are learning to adapt
Fortunately, Germany appears to have avoided energy shocks from the Russia-Ukraine war. Germany had previously imported over 50% of its natural gas from Russia. Manufacturing output declined by much less than was feared, and GVA rose by 0.25% last year. Germany has been able to source gas from areas such as Norway and the Netherlands, while also developing its own liquefied natural gas infrastructure.
The country’s shift to clean energy, Energiewende, has faced hurdles, but it has also been an area of innovation. Germany has become the leading G7 nation in low-carbon technologies as a share of GDP, signaling its progress in newer industries such as battery products and aspects of solar manufacturing, including photovoltaic components.
Germany has also gained ground in trade with the eurozone, the U.S. and other parts of the world. Prior to the COVID-19 pandemic, its exports to China rose to a record high but have since retreated following the lingering constraints the pandemic placed on supply chains.
German firms seek to broaden trade partners
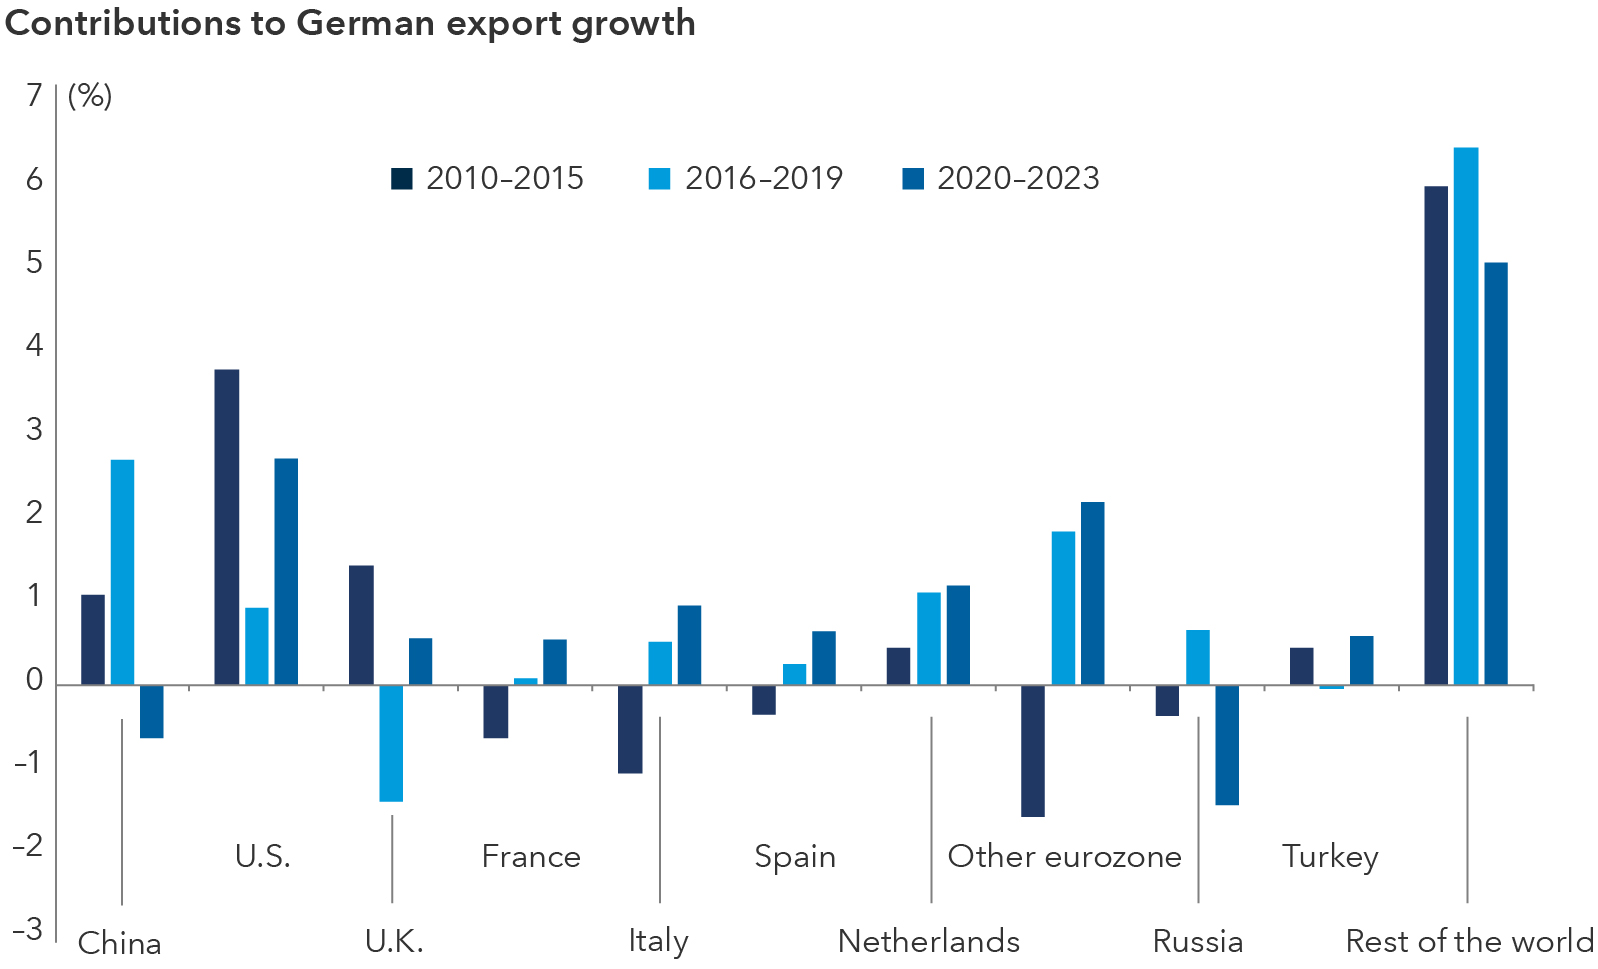
Source: International Monetary Fund Direction of Trade Statistics. Data as of March 31, 2024.
A vibrant Germany is necessary for Europe’s long-term health
The terms-of-trade shock induced by the pandemic and the Russia-Ukraine war appear to have abated. This should alleviate some of the pressure on Germany and the broader EU. With this, lower inflationary pressure should improve the nation‘s real incomes this year.
Undoubtedly, Germany’s economic contribution is vital to the EU, especially as Europe seeks to quell concerns around weaker growth. Technological innovation, trade and a firm geopolitical presence are all necessary for the EU to prosper. To regain its industrial dominance, Germany must have the freedom to maneuver with new trading partners.
Learn more about
Gross value added (GVA) - The value of the amount of goods produced by a nation or other economic entity, excluding input and material costs.
Group of Seven (G7) countries - The Group of Seven is an organization of the world’s advanced economies, including Canada, France, Germany, Italy, Japan, the United Kingdom and the United States. The European Union is also considered a member.
Trade-to-GDP ratio - A measure of the importance of international trade in an economy, calculated by dividing the aggregate value of exports and imports by gross domestic product.
Our latest insights
-
-
Artificial Intelligence
-
Technology & Innovation
-
-
Demographics & Culture
RELATED INSIGHTS
-
-
Technology & Innovation
-
Commissions, trailing commissions, management fees and expenses all may be associated with mutual fund investments. Please read the prospectus before investing. Mutual funds are not guaranteed, their values change frequently and past performance may not be repeated.
Unless otherwise indicated, the investment professionals featured do not manage Capital Group‘s Canadian mutual funds.
References to particular companies or securities, if any, are included for informational or illustrative purposes only and should not be considered as an endorsement by Capital Group. Views expressed regarding a particular company, security, industry or market sector should not be considered an indication of trading intent of any investment funds or current holdings of any investment funds. These views should not be considered as investment advice nor should they be considered a recommendation to buy or sell.
Statements attributed to an individual represent the opinions of that individual as of the date published and do not necessarily reflect the opinions of Capital Group or its affiliates. This information is intended to highlight issues and not be comprehensive or to provide advice. For informational purposes only; not intended to provide tax, legal or financial advice. We assume no liability for any inaccurate, delayed or incomplete information, nor for any actions taken in reliance thereon. The information contained herein has been supplied without verification by us and may be subject to change. Capital Group funds are available in Canada through registered dealers. For more information, please consult your financial and tax advisors for your individual situation.
Forward-looking statements are not guarantees of future performance, and actual events and results could differ materially from those expressed or implied in any forward-looking statements made herein. We encourage you to consider these and other factors carefully before making any investment decisions and we urge you to avoid placing undue reliance on forward-looking statements.
The S&P 500 Composite Index (“Index”) is a product of S&P Dow Jones Indices LLC and/or its affiliates and has been licensed for use by Capital Group. Copyright © 2024 S&P Dow Jones Indices LLC, a division of S&P Global, and/or its affiliates. All rights reserved. Redistribution or reproduction in whole or in part are prohibited without written permission of S&P Dow Jones Indices LLC.
FTSE source: London Stock Exchange Group plc and its group undertakings (collectively, the "LSE Group"). © LSE Group 2024. FTSE Russell is a trading name of certain of the LSE Group companies. "FTSE®" is a trade mark of the relevant LSE Group companies and is used by any other LSE Group company under licence. All rights in the FTSE Russell indices or data vest in the relevant LSE Group company which owns the index or the data. Neither LSE Group nor its licensors accept any liability for any errors or omissions in the indices or data and no party may rely on any indices or data contained in this communication. No further distribution of data from the LSE Group is permitted without the relevant LSE Group company's express written consent. The LSE Group does not promote, sponsor or endorse the content of this communication. The index is unmanaged and cannot be invested in directly.
BLOOMBERG® is a trademark and service mark of Bloomberg Finance L.P. and its affiliates (collectively “Bloomberg”). Bloomberg or Bloomberg’s licensors own all proprietary rights in the Bloomberg Indices. Neither Bloomberg nor Bloomberg’s licensors approves or endorses this material, or guarantees the accuracy or completeness of any information herein, or makes any warranty, express or implied, as to the results to be obtained therefrom and, to the maximum extent allowed by law, neither shall have any liability or responsibility for injury or damages arising in connection therewith.
MSCI does not approve, review or produce reports published on this site, makes no express or implied warranties or representations and is not liable whatsoever for any data represented. You may not redistribute MSCI data or use it as a basis for other indices or investment products.
Capital believes the software and information from FactSet to be reliable. However, Capital cannot be responsible for inaccuracies, incomplete information or updating of the information furnished by FactSet. The information provided in this report is meant to give you an approximate account of the fund/manager's characteristics for the specified date. This information is not indicative of future Capital investment decisions and is not used as part of our investment decision-making process.
Indices are unmanaged and cannot be invested in directly. Returns represent past performance, are not a guarantee of future performance, and are not indicative of any specific investment.
All Capital Group trademarks are owned by The Capital Group Companies, Inc. or an affiliated company in Canada, the U.S. and other countries. All other company names mentioned are the property of their respective companies.
Capital Group funds are offered in Canada by Capital International Asset Management (Canada), Inc., part of Capital Group, a global investment management firm originating in Los Angeles, California in 1931. Capital Group manages equity assets through three investment groups. These groups make investment and proxy voting decisions independently. Fixed income investment professionals provide fixed income research and investment management across the Capital organization; however, for securities with equity characteristics, they act solely on behalf of one of the three equity investment groups.
The Capital Group funds offered on this website are available only to Canadian residents.