Global
 Jeremy Burge
 Kathrin Forrest
For advisor use only. Not for use with investors.
The only game in town?
That’s how a growing number of investors have come to view the U.S., its technology and communications sectors and the Magnificent Seven. Who can blame them? The U.S. has led all developed markets results-wise for years, the country’s tech sector continues to shine, and few investors need to be reminded what the Magnificent Seven (M7) have done this year.
Why bother looking any further?
For one thing, the makeup of the broad MSCI All Country World Index (ACWI) and S&P 500 Index have shifted meaningfully over the past 10 years, becoming increasingly concentrated.
Within the ACWI, U.S. companies have grown from 47.5% of the index as of September 30, 2013, to 62.3% at September 30, 2023. A similar story can be told about sector weights in the S&P 500. The combined information technology and communication services sectors increased from 26.3% of the index to 36.3% from September 30, 2018, to September 30, 2023 (the communication services sector was only added to the Global Investment Classification System in 2018). The top 10 companies in the S&P 500 have likewise risen in weight over the past 10 years, from 17.7% to 30.6%.
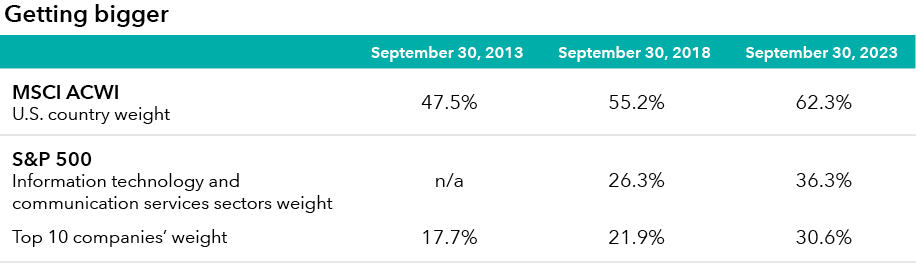
Sources: Capital Group, MSCI.
“These aren’t the same indices they used to be,” says equity investment specialist Kathrin Forrest.
Market concentrations of returns have meaningfully changed index composition, according to Forrest. Although she acknowledges recent areas of strength may persist, she says some investors may want to revisit today’s higher index concentrations to ensure underlying investment exposures are still meeting investment objectives, whatever they may be.
“Ultimately, a core principle of portfolio construction is diversification, but today’s underlying market concentrations may be sabotaging this to some extent for investors,” she says.
What’s the answer?
“Going beyond the obvious to find more, better ideas,” she says.
Tellingly, Capital Group Global Equity FundTM (Canada) had 49.7% of total net assets invested in the U.S. compared to 62.3% for the ACWI as of September 30, 2023.
“Country allocations are a byproduct of our bottom-up, fundamental research and we continue to find a number of compelling investment opportunities with strong underlying growth drivers,” says Global Equity portfolio manager Jeremy Burge.
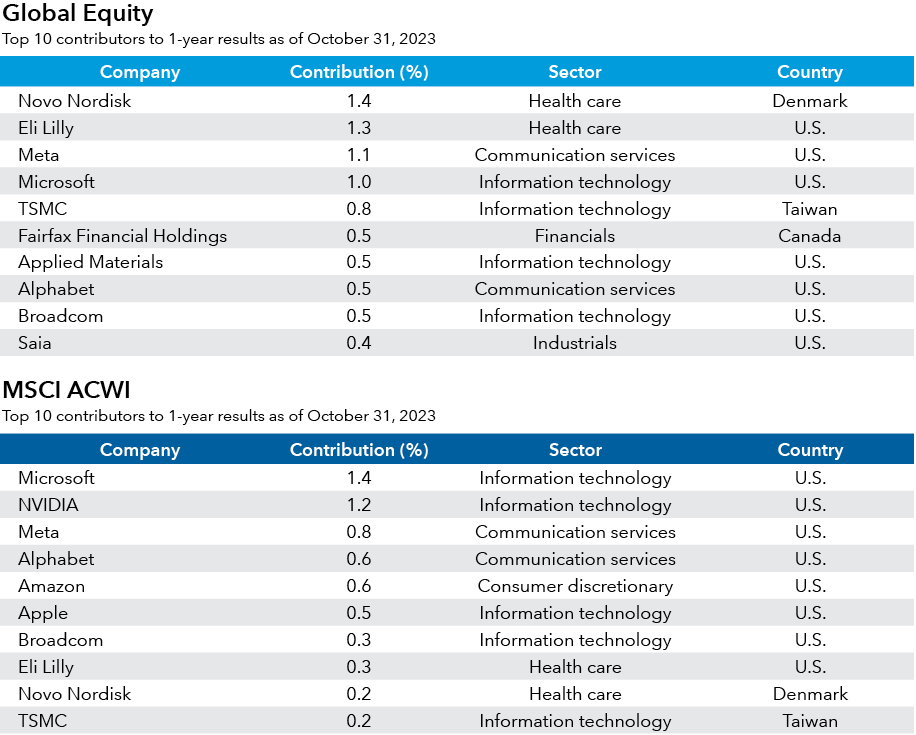
Top contributors
That may be best illustrated by Global Equity’s top 10 contributors to one-year results through October 31, 2023. Novo Nordisk and Eli Lilly, which rank one and two among contributors, respectively, are at the leading edge of innovation in terms of drug discovery; a key area that may support long term growth of capital. Microsoft and Meta are both re-accelerating in the face of new technologies, including AI and, in the case of Meta, the company has sharpened focus on cost control and capital allocation.
In fact, Global Equity’s top 10 contributors for the period have a broad set of underlying drivers, whether you measure it by geography, sector, or company-specific considerations. These include improving industry cycle and structure dynamics for less-than-truckload shipper Saia, and a strengthened core business at Canadian financials company FairFax Financial.
“What do these companies have in common?” asks Burge. “Not much at all, and that’s really underscoring the fund’s focus on finding diversified, differentiated sources of returns,” he says.
Another factor to keep in mind is that country of domicile may have little to do with a company’s revenues and earnings streams.
Sources: Capital Group, FactSet.
“Is BAE Systems a British defence company?” asks Burge rhetorically in reference to a Global Equity holding. “No, 47.8% of its revenues came from the U.S. defence department in 2022. Is FairFax Financial a Canadian property and casualty insurer? No, 48.5% of its 2022’s revenue came from the U.S. Is Novo Nordisk a Danish pharmaceutical company? Again no, when you consider 47.8% of its revenue came from the U.S. last year,” he says.
Going farther, digging deeper
In comparison, the broader market’s top six contributors over the one-year period to October 31, 2023, are M7 companies: Microsoft, NVIDIA , Meta, Alphabet, Amazon and Apple (Tesla, which rounds out the M7, didn’t make the cut). According to Burge, there may be reasons to own some of the M7 at times (Microsoft, Meta, and Alphabet were among Global Equity’s top-10 holdings as of October 31, 2023) but owning all of them all at once as a momentum play is short-term thinking.
“This is not a homogenous group,” says Burge continuing, “You’ve got a car manufacturer, a chip maker, two companies with large exposures to advertising dollars and a phone maker among them. If you're going to construct a portfolio, you've got to do it bottom-up using individual company research because buying all of them on momentum may only work until it doesn’t.”
S&P 493
The level of concentration some investors may be exposing themselves to — particularly passive index investors — is worth considering. The M7 accounted for a staggering 130% of the index’s total return in the first 10 months of 2023 in U.S. dollar terms. In other words, without the M7, the S&P 493 would have posted a decline. That’s a remarkable level of potential risk packed into a handful of companies, particularly if the market environment takes a turn for the worse.
While Global Equity’s investment decisions are based on fundamental, bottom-up research, understanding a company’s broader operating environment is critical. Currently, overall macro variables seem quite unsettled, whether that’s related to the path of inflation and interest rates, the interplay of monetary and fiscal policy, regulation, elections, or geopolitical tensions.
With that in mind, Global Equity looks to find companies that can do well in various macroeconomic scenarios, including recession. Some of the individual company features that matter to Burge are strong competitive positions, resilient end markets and solid balance sheets that generate free cash flow. The key is managing the fund in such a way that it does what it’s supposed to do.
All of which may lead to country exposures, sector allocations and top contributors that may be less obvious to some.
This content is confidential and designed for the exclusive use of registered dealers and their representatives. Canadian securities legislation, including National Instrument 81-102, prohibits its distribution to investors, potential investors or the general public. It is not intended to be a sales communication, as defined in the Instrument, and has not been designed to comply with its requirements relating to sales communications.
Annualized compound returns as of October 31, 2023, including reinvestment of all distributions, for Global Equity Series A vs. the benchmark index: 1 year: 11.23% vs 12.46%; 3 years: 1.07% vs. 8.13%; 5 years: 6.95% vs. 8.67%; 10 years: 8.98% vs. 9.91%; fund lifetime (since November 1, 2002): 7.74% vs. 7.01%.
Annualized compound returns as of October 31, 2023, including reinvestment of all distributions, for Global Equity Series F vs. the benchmark index: 1 year: 12.46% vs 12.46%; 3 years: 2.19% vs. 8.13%; 5 years: 8.13% vs. 8.67%; 10 years: 10.20% vs. 9.91%; fund lifetime (since November 1, 2002): 8.92% vs. 7.01%.
Equity attribution data was produced using FactSet, a third-party software system, based on prior calendar quarter-end publicly disclosed portfolio(s). Securities in their initial period of acquisition may not be included in this analysis. The analysis includes equity investments only and excludes forward contracts and fixed income investments, if applicable. It does not account for buy and sell transactions that might have occurred during the quarter. As a result, average portfolio weight percentages are approximate and the actual average portfolio weight percentages might be higher or lower. Data elements such as pricing, income, market cap, etc. were provided by FactSet. The index provided for attribution is based on FactSet’s methodology. The index is a broad-based market benchmark and may not be used by Capital Group as the sole comparative index for this portfolio. Capital Group believes the software and information from FactSet to be reliable. However, Capital Group cannot be responsible for inaccuracies, incomplete information or updating of information by FactSet. Relative contribution measures the impact a security has on the portfolio's excess return (the portfolio return minus the benchmark return). Past results are not indicative of results in future periods. All of the attribution data contained in the report that display the portfolio weights, benchmark weights and weight differences are average weights over the period.
Our latest insights
-
-
Interest Rates
-
Global Equities
-
Artificial Intelligence
-
Technology & Innovation
RELATED INSIGHTS
-
Global Equities
-
U.S. Equities
-
Commissions, trailing commissions, management fees and expenses all may be associated with mutual fund investments. Please read the prospectus before investing. Mutual funds are not guaranteed, their values change frequently and past performance may not be repeated.
Unless otherwise indicated, the investment professionals featured do not manage Capital Group‘s Canadian mutual funds.
References to particular companies or securities, if any, are included for informational or illustrative purposes only and should not be considered as an endorsement by Capital Group. Views expressed regarding a particular company, security, industry or market sector should not be considered an indication of trading intent of any investment funds or current holdings of any investment funds. These views should not be considered as investment advice nor should they be considered a recommendation to buy or sell.
Statements attributed to an individual represent the opinions of that individual as of the date published and do not necessarily reflect the opinions of Capital Group or its affiliates. This information is intended to highlight issues and not be comprehensive or to provide advice. For informational purposes only; not intended to provide tax, legal or financial advice. We assume no liability for any inaccurate, delayed or incomplete information, nor for any actions taken in reliance thereon. The information contained herein has been supplied without verification by us and may be subject to change. Capital Group funds are available in Canada through registered dealers. For more information, please consult your financial and tax advisors for your individual situation.
Forward-looking statements are not guarantees of future performance, and actual events and results could differ materially from those expressed or implied in any forward-looking statements made herein. We encourage you to consider these and other factors carefully before making any investment decisions and we urge you to avoid placing undue reliance on forward-looking statements.
The S&P 500 Composite Index (“Index”) is a product of S&P Dow Jones Indices LLC and/or its affiliates and has been licensed for use by Capital Group. Copyright © 2024 S&P Dow Jones Indices LLC, a division of S&P Global, and/or its affiliates. All rights reserved. Redistribution or reproduction in whole or in part are prohibited without written permission of S&P Dow Jones Indices LLC.
FTSE source: London Stock Exchange Group plc and its group undertakings (collectively, the "LSE Group"). © LSE Group 2024. FTSE Russell is a trading name of certain of the LSE Group companies. "FTSE®" is a trade mark of the relevant LSE Group companies and is used by any other LSE Group company under licence. All rights in the FTSE Russell indices or data vest in the relevant LSE Group company which owns the index or the data. Neither LSE Group nor its licensors accept any liability for any errors or omissions in the indices or data and no party may rely on any indices or data contained in this communication. No further distribution of data from the LSE Group is permitted without the relevant LSE Group company's express written consent. The LSE Group does not promote, sponsor or endorse the content of this communication. The index is unmanaged and cannot be invested in directly.
BLOOMBERG® is a trademark and service mark of Bloomberg Finance L.P. and its affiliates (collectively “Bloomberg”). Bloomberg or Bloomberg’s licensors own all proprietary rights in the Bloomberg Indices. Neither Bloomberg nor Bloomberg’s licensors approves or endorses this material, or guarantees the accuracy or completeness of any information herein, or makes any warranty, express or implied, as to the results to be obtained therefrom and, to the maximum extent allowed by law, neither shall have any liability or responsibility for injury or damages arising in connection therewith.
MSCI does not approve, review or produce reports published on this site, makes no express or implied warranties or representations and is not liable whatsoever for any data represented. You may not redistribute MSCI data or use it as a basis for other indices or investment products.
Capital believes the software and information from FactSet to be reliable. However, Capital cannot be responsible for inaccuracies, incomplete information or updating of the information furnished by FactSet. The information provided in this report is meant to give you an approximate account of the fund/manager's characteristics for the specified date. This information is not indicative of future Capital investment decisions and is not used as part of our investment decision-making process.
Indices are unmanaged and cannot be invested in directly. Returns represent past performance, are not a guarantee of future performance, and are not indicative of any specific investment.
All Capital Group trademarks are owned by The Capital Group Companies, Inc. or an affiliated company in Canada, the U.S. and other countries. All other company names mentioned are the property of their respective companies.
Capital Group funds are offered in Canada by Capital International Asset Management (Canada), Inc., part of Capital Group, a global investment management firm originating in Los Angeles, California in 1931. Capital Group manages equity assets through three investment groups. These groups make investment and proxy voting decisions independently. Fixed income investment professionals provide fixed income research and investment management across the Capital organization; however, for securities with equity characteristics, they act solely on behalf of one of the three equity investment groups.
The Capital Group funds offered on this website are available only to Canadian residents.