Emerging Markets
 Robert Burgess
 Harry Phinney
In 2024, numerous factors appear to be turning in favour of emerging markets (EM) debt despite the potential for weak global economic growth. A more dovish U.S. Federal Reserve (Fed) should support a rebound for EM economies. This is likely to benefit both higher-rated local currency debt — and to an extent, dollar-denominated debt — which spans a wide variety of economies and markets, extending all the way to the riskier and smaller economies often referred to as the frontier markets.
We see the largest opportunities within core (higher rated) local currency sovereign debt, along with select investment-grade (rated BBB/Baa and above) and high-yield dollar-denominated sovereign issuers. If incoming inflation data permits the Fed to cut rates, it should allow the central banks in EM countries to move in a direction that better reflects their domestic outlooks. Dollar-denominated issuers may also benefit from potentially lower funding costs. In most of the core economies, inflation is expected to decline throughout 2024. Falling interest rates should be positive for duration, especially for local currency debt holders.
While EM currencies recovered in 2023, the strength of the U.S. dollar could still pose a challenge, even though the dollar looks overvalued on most fundamental metrics. This could change with lower U.S. rates, although the process of unwinding dollar strength is likely to be gradual given the real rate level is still supportive of the dollar over other major currencies, and growth outside the U.S. remains relatively weak. Elections in several EM countries could also disrupt the status quo.
The table below shows how EM currencies and debt have performed before and after the Fed began cutting rates in previous cycles. Both local and hard currency (dollar-denominated) bonds have rallied the most prior to earlier rate cuts, while EM currencies have performed better after the rate cuts began.
How EMs performed in previous Fed rate-cutting cycles
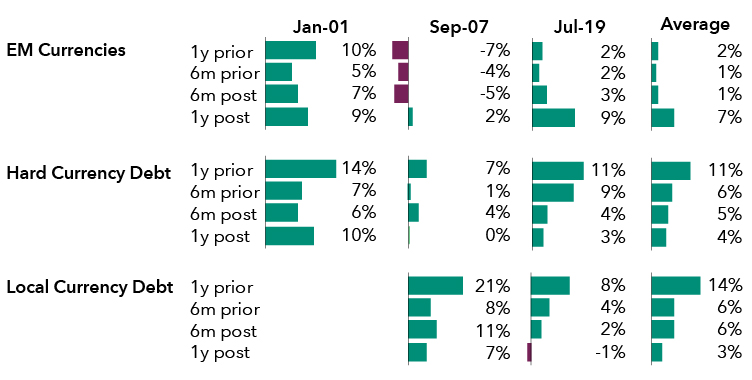
Sources: Bloomberg, J.P. Morgan. Past results are not a guarantee of future results. Hard currency debt represented by J.P. Morgan Emerging Markets Bond Index — Global Diversified (EMBI). Local currency debt represented by J.P. Morgan Government Bond Index — Emerging Markets Global Diversified (GBI-EM GD). EM currencies represented by EM currencies weighted by GBI-EM GD versus the U.S. dollar. Exact dates are as follows: January 3, 2001; September 18, 2007; and July 31, 2019. Returns in USD.
The U.S. may escape recession, even if global growth remains weak
EM assets have historically been highly correlated with U.S. economic growth. The U.S. economy looks poised to maintain an economic growth rate above 2%, even as it contends with the lagged effects of tightening financial conditions. Labour markets remain robust, although rising consumer debt has caused some concerns.
EM debt spreads during U.S. rate cycles and recessions
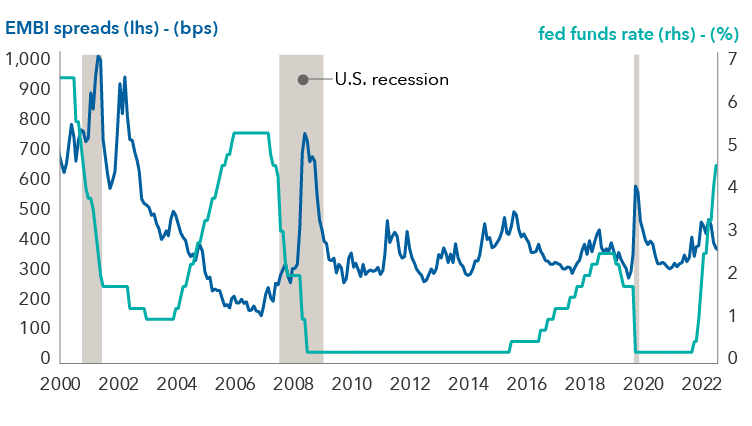
Sources: Bloomberg, J.P. Morgan. As of November 30, 2023. Past results are not a guarantee of future results. Left vertical axis: J.P. Morgan Emerging Markets Bond Index (EMBI) spreads (bps). Right vertical axis: federal funds rate (%). Shaded periods are U.S. recessions as determined by the National Bureau of Economic Research.
Outside of the U.S., growth is expected to remain relatively weak. Compared to the U.S., Europe was hit more heavily by the energy shock, and the region still faces some of the most difficult policy challenges with the tradeoff between inflation and growth. Eurozone economic activity has stabilized at subdued levels, and there remains a significant risk of contraction in some economies. However, we could experience a recovery in the second half of 2024, if increased investment in areas like the energy transition and defence picks up, inflation comes down and consumers start to see the benefits of stronger real income growth.
China is likely to have to adjust to a decelerating growth rate in the coming years. Elsewhere in the emerging markets, we expect continued economic expansion in Asia (outside of China), a deceleration in Latin America and broadly stable growth in Europe, the Middle East and Africa.
Core emerging markets bonds may benefit from declining rates
If monetary policy loosens in major developed markets, a decline in interest rates could work in favour of local currency EM bonds. While EM countries have traditionally struggled with inflation, more developed EM central banks have raised interest rates earlier and more aggressively than the developed world to prevent people’s inflation expectations from accelerating.
Inflation now looks ready to return to central bank comfort zones for most EM countries by the end of 2024. As a result, a long duration position looks attractive in many Latin American markets, including Brazil and Mexico. Long duration positioning also looks compelling in South Africa, whose real rates are near the upper end of historical ranges and have more room to decline than U.S. Treasuries.
Interest rates expected to come down in EM
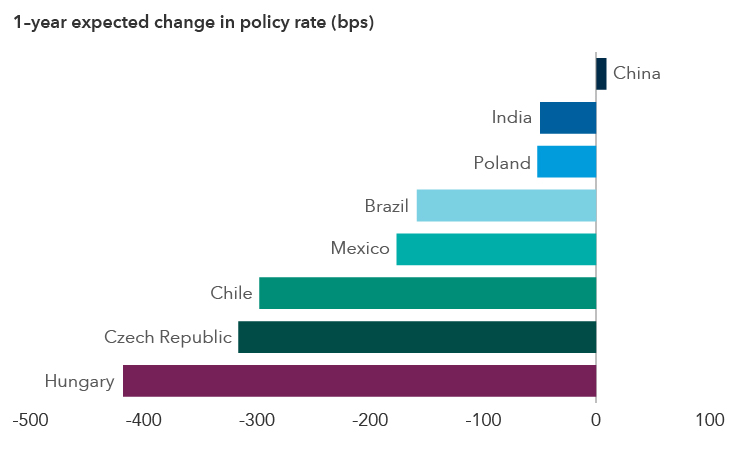
Source: Bloomberg. As of February 16, 2024.
Central banks in Asia are likely to cut rates later than the rest of the EM world. Asian local currency debt tends to be more correlated with global markets, but duration opportunities still exist. In China, low yields seem justified by stubbornly low inflation and growth challenges.
Caution is still warranted in Central Europe. Inflation does seem to have rolled over (although it appears unlikely to return to target as projected), and growth has been sluggish. However, those trends are reflected in local yields, with aggressive easing cycles priced into bonds.
Across hard currency debt, spreads are fairly tight within the core investment-grade EM economies. But compared to U.S. investment-grade corporate bonds, spreads look reasonably attractive, thus presenting some relative value opportunities. Absolute yield levels also remain reasonably high. Part of the appeal of these holdings is that they provide diversification benefits to portfolios. South Korea and Mexico are examples of some higher rated credits in which we have conviction.
Some corporate U.S. dollar issuers may also present value. Fundamentals within EM corporates look solid as most EM corporate treasurers have taken a prudent approach to borrowing. The geographic representation and risk structure of EM corporates is quite different from sovereigns, and thus provides an element of diversification.
Frontier markets face greater challenges
The Fed’s pivot should reduce external financing pressures on frontier markets, but they will likely continue to face headwinds from relatively weak global growth, persistent dollar strength and higher U.S. rates than in the prior two decades (even with a more dovish Fed). Spreads on most of these credits are still relatively wide, offering a significant valuation cushion in many cases. However, selectivity is key.
EM debt spreads by rating group
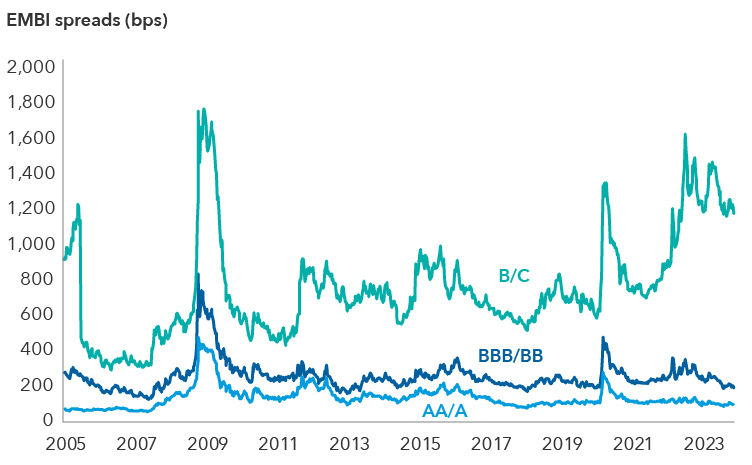
Source: J.P. Morgan Emerging Markets Bond Index (EMBI). As of December 1, 2023.
Attractive opportunities, but some risks to consider
Over half the world’s population will be asked to go to the polls in 2024. In addition to parts of the developed world, this includes many core EM countries, such as India, South Africa, Indonesia and Mexico, as well as a number of countries that are potentially heading toward or already in the midst of debt restructuring, such as Sri Lanka, Ukraine and Ghana. With so many economies heading into an election year, volatility could potentially increase, so diversification will be key for investors. Likewise, geopolitical risks remain elevated and warrant careful monitoring.
Overall, developing economies have proven to be resilient in recent years, and we believe emerging markets debt will remain compelling for investors if fundamentals and starting yields continue to look broadly attractive. These markets were thoroughly tested in 2023 and came out stronger for it. In addition to the aggressive U.S. rate-hiking cycle, emerging markets also had to contend with wars, U.S. banking stress in March and a sharp bond selloff. The fact that the more developed EMs were able to weather this volatility without significant impact demonstrates the progress these economies have made.
The value of fixed income securities may be affected by changing interest rates and changes in credit ratings of the securities.
The J.P. Morgan Emerging Markets Bond Index (EMBI) Global Diversified is a uniquely weighted emerging markets debt benchmark that tracks total returns for U.S. dollar-denominated bonds issued by emerging markets sovereign and quasi-sovereign entities. This index is unmanaged, and its results include reinvested dividends and/or distributions but do not reflect the effect of account fees, expenses or U.S. federal income taxes.
J.P. Morgan Government Bond Index – Emerging Markets Global Diversified covers the universe of regularly traded liquid fixed-rate domestic currency emerging market government bonds to which international investors can gain exposure. This index is unmanaged, and its results include reinvested dividends and/or distributions but do not reflect the effect of account fees, expenses or U.S. federal income taxes.
Credit rating – Typically ranging from AAA/Aaa (highest) to D (lowest), these are assigned by credit rating agencies such as Standard & Poor’s, Moody’s and/or Fitch as an indication of an issuer’s creditworthiness.
Credit spread – A credit spread is the difference in yield (the expected return on an investment over a particular period of time) between a government bond and another debt security of the same maturity but different credit quality.
Duration measures a bond’s sensitivity to changes in interest rates. Generally, a bond's price will go up 1% for every year of duration if interest rates fall by 1% or will go down 1% for every year of duration if interest rates rise by 1%.
Frontier market – Countries with investable stock markets that are less established than those in the emerging markets.
Hard currency – Refers to money issued by a nation that is seen as politically and economically stable. Hard currencies are widely accepted around the world as a form of payment for goods and services and may be preferred over the domestic (local) currency.
Inflation – The rise in the prices of goods and services, as happens when spending increases relative to the supply of goods on the market – in other words, too much money chasing too few goods. Core inflation metrics strip out volatile items like food and energy.
Issuer – A legal entity that develops, registers and sells securities to finance its operations. Issuers may be corporations, investment trusts, or governments.
Policy rate – An interest rate set by a central bank to implement its monetary policy.
Our latest insights
-
-
Interest Rates
-
Global Equities
-
Artificial Intelligence
-
Technology & Innovation
RELATED INSIGHTS
-
Interest Rates
-
Emerging Markets
-
Commissions, trailing commissions, management fees and expenses all may be associated with mutual fund investments. Please read the prospectus before investing. Mutual funds are not guaranteed, their values change frequently and past performance may not be repeated.
Unless otherwise indicated, the investment professionals featured do not manage Capital Group‘s Canadian mutual funds.
References to particular companies or securities, if any, are included for informational or illustrative purposes only and should not be considered as an endorsement by Capital Group. Views expressed regarding a particular company, security, industry or market sector should not be considered an indication of trading intent of any investment funds or current holdings of any investment funds. These views should not be considered as investment advice nor should they be considered a recommendation to buy or sell.
Statements attributed to an individual represent the opinions of that individual as of the date published and do not necessarily reflect the opinions of Capital Group or its affiliates. This information is intended to highlight issues and not be comprehensive or to provide advice. For informational purposes only; not intended to provide tax, legal or financial advice. We assume no liability for any inaccurate, delayed or incomplete information, nor for any actions taken in reliance thereon. The information contained herein has been supplied without verification by us and may be subject to change. Capital Group funds are available in Canada through registered dealers. For more information, please consult your financial and tax advisors for your individual situation.
Forward-looking statements are not guarantees of future performance, and actual events and results could differ materially from those expressed or implied in any forward-looking statements made herein. We encourage you to consider these and other factors carefully before making any investment decisions and we urge you to avoid placing undue reliance on forward-looking statements.
The S&P 500 Composite Index (“Index”) is a product of S&P Dow Jones Indices LLC and/or its affiliates and has been licensed for use by Capital Group. Copyright © 2024 S&P Dow Jones Indices LLC, a division of S&P Global, and/or its affiliates. All rights reserved. Redistribution or reproduction in whole or in part are prohibited without written permission of S&P Dow Jones Indices LLC.
FTSE source: London Stock Exchange Group plc and its group undertakings (collectively, the "LSE Group"). © LSE Group 2024. FTSE Russell is a trading name of certain of the LSE Group companies. "FTSE®" is a trade mark of the relevant LSE Group companies and is used by any other LSE Group company under licence. All rights in the FTSE Russell indices or data vest in the relevant LSE Group company which owns the index or the data. Neither LSE Group nor its licensors accept any liability for any errors or omissions in the indices or data and no party may rely on any indices or data contained in this communication. No further distribution of data from the LSE Group is permitted without the relevant LSE Group company's express written consent. The LSE Group does not promote, sponsor or endorse the content of this communication. The index is unmanaged and cannot be invested in directly.
BLOOMBERG® is a trademark and service mark of Bloomberg Finance L.P. and its affiliates (collectively “Bloomberg”). Bloomberg or Bloomberg’s licensors own all proprietary rights in the Bloomberg Indices. Neither Bloomberg nor Bloomberg’s licensors approves or endorses this material, or guarantees the accuracy or completeness of any information herein, or makes any warranty, express or implied, as to the results to be obtained therefrom and, to the maximum extent allowed by law, neither shall have any liability or responsibility for injury or damages arising in connection therewith.
MSCI does not approve, review or produce reports published on this site, makes no express or implied warranties or representations and is not liable whatsoever for any data represented. You may not redistribute MSCI data or use it as a basis for other indices or investment products.
Capital believes the software and information from FactSet to be reliable. However, Capital cannot be responsible for inaccuracies, incomplete information or updating of the information furnished by FactSet. The information provided in this report is meant to give you an approximate account of the fund/manager's characteristics for the specified date. This information is not indicative of future Capital investment decisions and is not used as part of our investment decision-making process.
Indices are unmanaged and cannot be invested in directly. Returns represent past performance, are not a guarantee of future performance, and are not indicative of any specific investment.
All Capital Group trademarks are owned by The Capital Group Companies, Inc. or an affiliated company in Canada, the U.S. and other countries. All other company names mentioned are the property of their respective companies.
Capital Group funds are offered in Canada by Capital International Asset Management (Canada), Inc., part of Capital Group, a global investment management firm originating in Los Angeles, California in 1931. Capital Group manages equity assets through three investment groups. These groups make investment and proxy voting decisions independently. Fixed income investment professionals provide fixed income research and investment management across the Capital organization; however, for securities with equity characteristics, they act solely on behalf of one of the three equity investment groups.
The Capital Group funds offered on this website are available only to Canadian residents.